Our Services
An overview of our sell-side M&A services

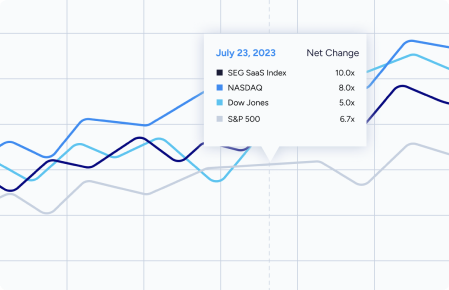
The Data Shows SaaS is Here to Stay
In 2023, M&A activity surged, marking the second-highest transaction count, closely following 2022. The SEG SaaS Index™ soared, posting an impressive 34% growth for the year.


Whether you are looking for a majority recap or strategic sale, have a buyer and just need help uncovering hidden value and navigating potential pitfalls, or just want insights on how to grow and scale your software business, we’re here to help.