Public SaaS Companies

SEG’s acclaimed research reports began in 2001 to help software executives, venture capitalists, and private equity investors worldwide stay informed on the software industry. This page brings SEG’s research to life in an interactive and digestible way and serves as a tool to provide high-quality insights for industry professionals in real time.

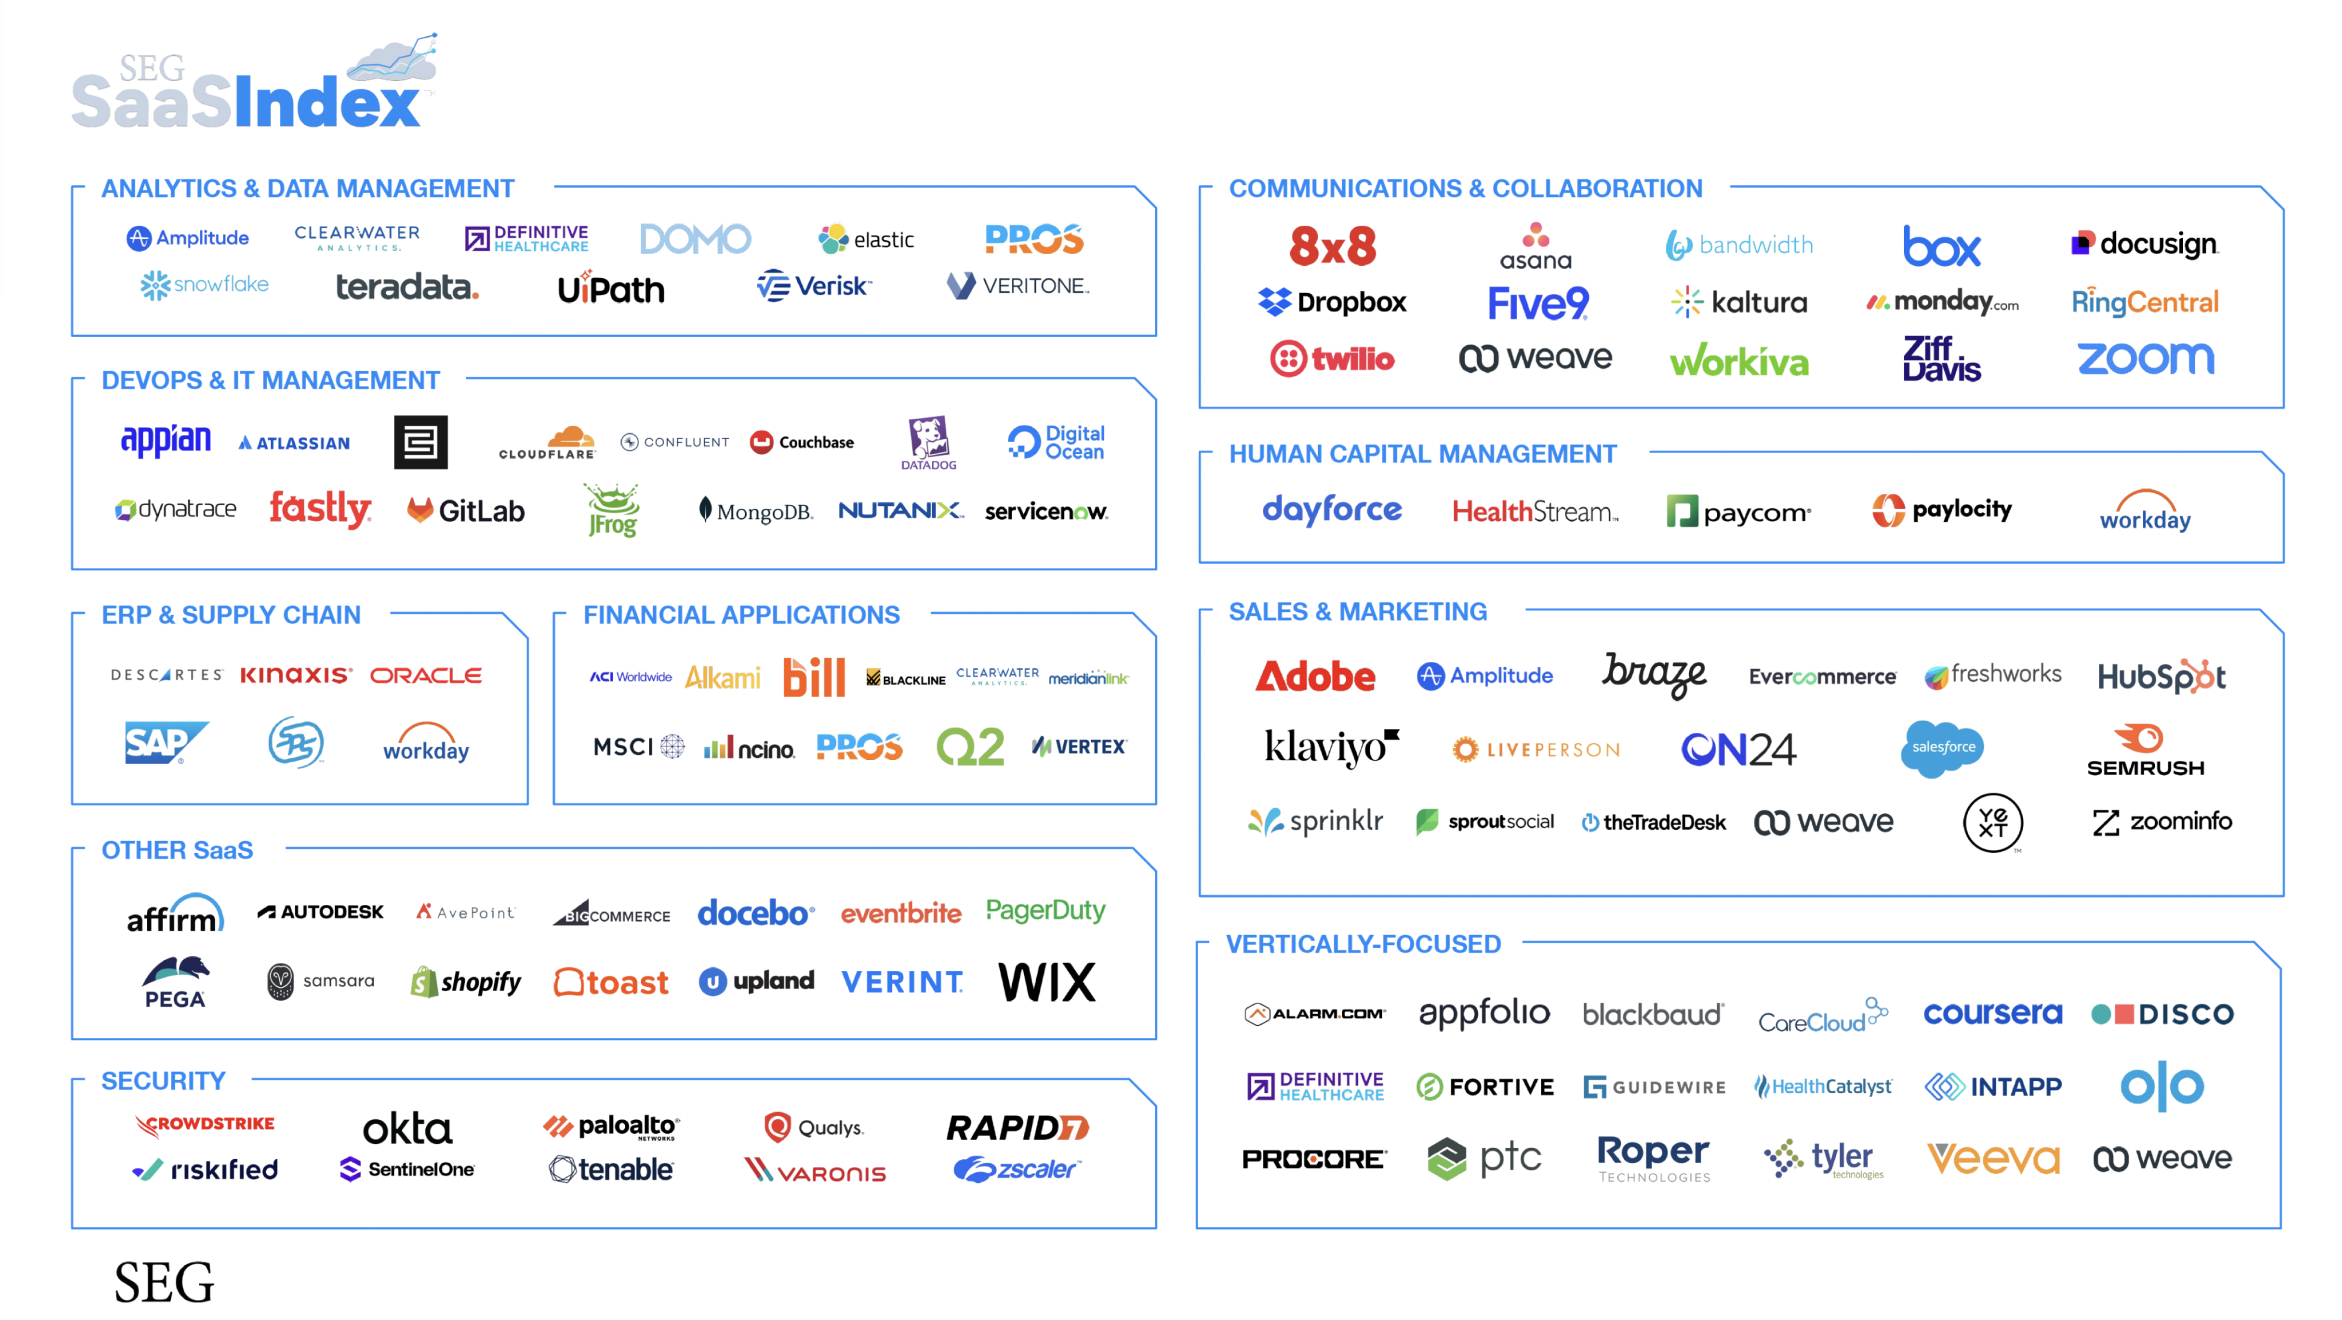
The SEG SaaS IndexTM was founded in 2006 and today comprises 120+ publicly traded companies that primarily offer solutions via the cloud. The Index is updated every quarter depending on acquisitions, IPOs, readily available financial data, and changes in business models. Interact with the charts below to see how public SaaS companies perform and how the SEG SaaS Index compares to other major indices.

READ MORE: Learn how to benchmark and analyze your business against the 120+ public SaaS companies forming the SEG SaaS Index™.

Stock Market Indices

See how the median stock price performance for the SEG SaaS Index stacks up against other major stock market indices. The chart compares the stock price percentage change from the starting date to the end date for the period selected on the right. Compare the percentage change at any point in time by hovering over the chart below.
-8.7%
SEG SaaS Index
-1.0%
Dow Jones
-7.8%
NASDAQ 100
-3.4%
S&P 500
10%10%5%5%0%0%-5%-5%-10%-10%-15%-15%Stock Price Percentage ChangeJan 2025Jan 2025Jan 2025Jan 2025Jan 2025Jan 2025Feb 2025Feb 2025Feb 2025Feb 2025Mar 2025Mar 2025
SEG SaaS Index
Dow Jones
NASDAQ 100
S&P 500
Download SVG
Download PNG
Download CSV

SaaS Multiples

The chart below assesses the daily median EV/TTM Revenue multiple for companies in the SEG SaaS Index. Toggle the date filters on the right to see how the median revenue multiple changes over time. To see the median SaaS multiples at any point in time, hover over the chart below.
20x20x15x15x10x10x5x5x0x0xEV/TTM Revenue MultipleJan 2025Jan 2025Jan 2025Jan 2025Jan 2025Jan 2025Feb 2025Feb 2025Feb 2025Feb 2025Mar 2025Mar 2025
SEG SaaS Index
Download SVG
Download PNG
Download CSV

SaaS Companies

View key metrics for all 120 publicly traded SaaS companies that comprise the SEG SaaS Index below. Click any column header to sort by different metrics, and use the scroll bar on the right to view additional companies. Data in this report is updated daily. Filter by product category to see how your company compares to select SaaS companies. To learn how to use this data as a benchmark for your business, speak with an M&A advisor today.
Filter by Product Category
  • All
  • Analytics & Data Management
  • Communications & Collaboration
  • DevOps & IT Management
  • ERP & Supply Chain
  • Financial Applications
  • Human Capital Management
  • Other SaaS
  • Sales & Marketing
  • Security
  • Vertically Focused
Filter by Quartile
  • All
  • Top Quartile
  • 2nd Quartile
  • 3rd Quartile
  • Bottom Quartile

The Rule of 40 is calculated on a weighted basis, using the formula: (1.33 × Revenue Growth) + (0.67 × EBITDA Margin).

Revenue Multiple by Size

The SEG SaaS Index is evaluated by TTM Revenue, sorted from small to mega-sized companies. View the median EV/TTM Revenue multiple by cohort below, and toggle the date filters on the right to see how multiples change over time.
3.2x4.9x6.6x7.8xSmall Cap($0-$250M Rev)Small Cap ($0-$250M Rev)Mid Cap($250-$500M Rev)Mid Cap ($250-$500M Rev)Large Cap($500M-$1B Rev)Large Cap ($500M-$1B Rev)Mega Cap($1B+ Rev)Mega Cap ($1B+ Rev)8x8x6x6x4x4x2x2x0x0x
Download SVG
Download PNG
Download CSV
Median EV/TTM Revenue Multiple

Revenue Multiple by Category

The SEG SaaS Index is divided into 10 categories, covering everything from Security to Sales & Marketing, Enterprise Resource Planning (ERP) to Financial Applications, and more. See which types of companies are outperforming the rest by comparing the median EV/TTM Revenue multiple by product category. Click on the date filters on the right to see how the categories compare over time.
6x7x6x5x4x7x9x8x4x9xVerticallyFocusedVertically FocusedFinancialApplicationsFinancial ApplicationsSales & MarketingSales & MarketingOther SaaSOther SaaSCommunications& CollaborationCommunications & CollaborationHuman CapitalManagementHuman Capital ManagementERP & Supply ChainERP & Supply ChainSecuritySecurityAnalytics & Data ManagementAnalytics & Data ManagementDevOps & IT ManagementDevOps & IT Management10x10x8x8x6x6x4x4x2x2x0x0x
Download SVG
Download PNG
Download CSV
Median EV/TTM Revenue Multiple

Weighted Rule of 40%

The charts below examine the impact of Weighted Rule of 40% for public SaaS companies. The first chart highlights how companies in the SEG SaaS Index™ are distributed across Weighted Rule of 40% cohorts, while the second chart compares median EV/TTM Revenue multiples by Rule of 40 performance.

Weighted Rule of 40 Distribution

30.030.025.025.020.020.015.015.010.010.05.05.00.00.0Percentage of Companies23.1%11.1%27.4%22.2%16.2%<=10%<=10%>10%<=20%>10% <=20%>20%<=30%>20% <=30%>30%<=40%>30% <=40%>40%>40%Weighted Rule of 40 Percentages
Download SVG
Download PNG
Download CSV

EV/TTM Revenue vs. Weighted Rule of 40

15.015.010.010.05.05.00.00.0Median EV/TTM Revenue1.6x3.8x6.4x6.9x12.3x<=10%<=10%>10%<=20%>10% <=20%>20%<=30%>20% <=30%>30%<=40%>30% <=40%>40%>40%Weighted Rule of 40 Percentages
Download SVG
Download PNG
Download CSV

Net Revenue Retention

Explore the Net Revenue Retention (NRR) for public SaaS companies to see where most fall in today’s market. The first chart shows the distribution of net retention among public SaaS companies, while the second chart shows median EV/TTM Revenue multiples by NRR cohorts.

Net Retention Distribution

30.030.025.025.020.020.015.015.010.010.05.05.00.00.0Percentage of Companies9.3%29.1%26.7%26.7%8.1%<=90%<=90%>90%<=100%>90% <=100%>100%<=110%>100% <=110%>110%<=120%>110% <=120%>120%<=130%>120% <=130%Net Retention
Download SVG
Download PNG
Download CSV

EV/TTM Revenue vs. Net Retention

12.012.010.010.08.08.06.06.04.04.02.02.00.00.0Median EV/TTM Revenue1.7x4.4x5.1x6.4x10.1x<=90%<=90%>90%<=100%>90% <=100%>100%<=110%>100% <=110%>110%<=120%>110% <=120%>120%<=130%>120% <=130%Net Retention
Download SVG
Download PNG
Download CSV

It’s time to talk about your company’s future.

Fill out the form and we can discuss…

  • Multiples and interest
  • Buyer dynamics and priorities
  • Valuation insights
By clicking submit, I acknowledge that I have read and agree to the privacy policy and understand that I can unsubscribe from communications at any time.

Disclaimer

The information set forth in the SEG SaaS Index is provided for informational and discussion purposes only and is not intended to be, and shall not be regarded or construed as, a recommendation for a transaction or investment or financial, tax, investment, or other advice of any kind by SEG Capital Advisors LLC (“SEG”). SEG makes no warranty or representation regarding any such information, or the data presented in such materials, and SEG expressly disclaims any and all liability which may be based on the SEG SaaS Index or any of its contents, errors therein or omissions therefrom. SEG and/or individuals and entities affiliated with SEG, may purchase, sell, or hold securities of issuers that are constituents of the SEG SaaS Index from time to time and at any time, including in advance of or following an issuer being added to or removed from the SEG SaaS Index. Financial data was provided by Tiingo.