An overview of our sell-side M&A services


What Your SaaS Company’s Bridge Analysis Tells Potential Buyers
In previous posts, we discussed the importance of understanding ARR and how to properly calculate customer and ARR churn. In this post, we’ll explain how viewing these metrics in conjunction with each other can provide vital insights into your company, potentially having a tremendous impact on future operations. We can do this easily by using an annual recurring revenue bridge and a customer count bridge to illustrate this data.
A bridge chart is a visual tool used by businesses to analyze metrics over a specific period, typically a year, and is one of the most common ways to visualize top-line changes. Moreover, a bridge chart gets its name because it “bridges” the gap between the start of the period and the end for a particular metric, with a starting value, an ending value, and relevant variables in between.
When talking with potential buyers, whether PE investors or strategics, they will expect to see this type of information and much more. As a starting point to prepare your company for the best M&A outcome possible, consider performing a bridge analysis to gain further insights into the health of your SaaS company.
Annual Recurring Revenue Bridge
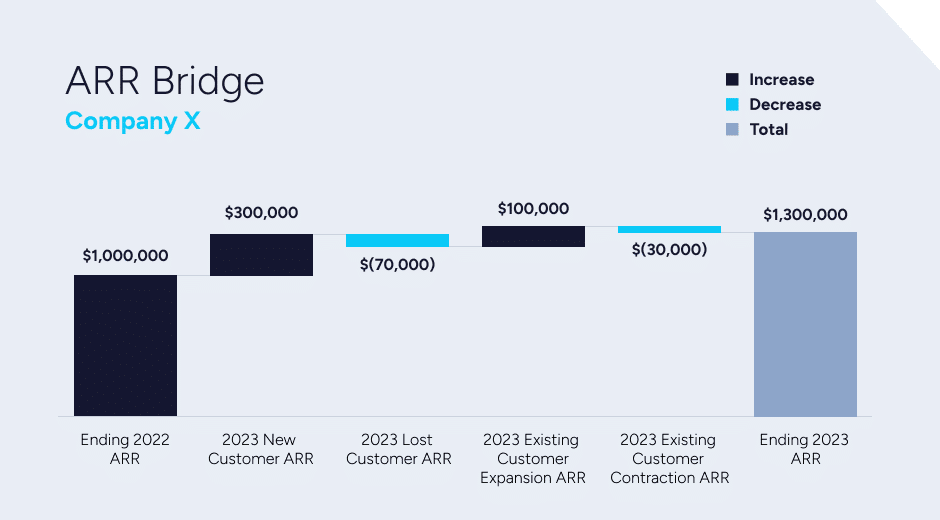
A key metric for most SaaS companies is ARR which is the amount of recurring revenue a business can expect to generate each year from subscriptions. The metric can be used year-over-year to offer a normalized way to compare operations over a period of time. An annual recurring revenue bridge depicts changes in a company’s ARR over a given year. It includes starting ARR, new ARR, lost ARR, and any ARR expansion or contraction of the existing customer base during the year.
Customer Count Bridge
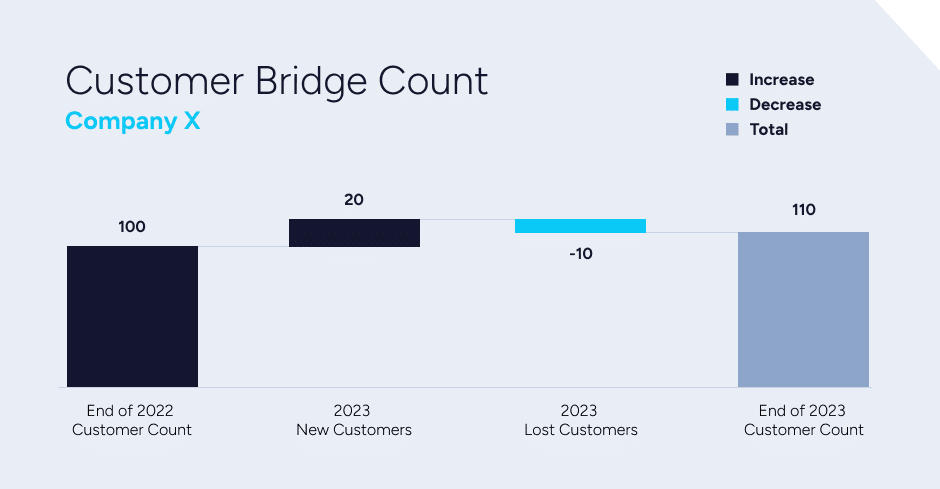
A customer count bridge depicts changes in a company’s customer count during a given year. It includes the number of customers at the beginning of the year, the number of new customers gained, and the number of churned customers lost, which results in the number of customers at the end of the period.
SaaS Company X: Bridge Analysis Example
Let’s say Company X ended 2022 with 100 customers worth $1,000,000 in ARR. This would be the starting customer count and ARR for 2023. Over the course of 2023, Company X brought on 20 new customers worth $300,000 in ARR and lost 10 customers worth $70,000 in ARR. A portion of existing customers collectively expanded by $100,000, while other existing customers collectively contracted by $30,000. The net result is Company X would have ended 2023 with $1,300,000 in ARR and 110 customers.
A look at the graphs below tells us that Company X is performing very well:
Understanding the Bridge Charts for Company X
Together, these two bridge charts convey a wealth of information. Not only did new customers grow ARR by 30%, but we can see that these were larger customers — the average new customer ARR was $15,000 ($300,000 new ARR/20 new customers) compared to the average customer size from 2022 when the average customer ARR was $10,000 ($1,000,000 in ARR/100 customers).
Lost ARR retention was 93%, gross ARR retention was 90%, net ARR retention was 100%, and customer logo retention was 90%.
We can also see that the customers Company X lost were smaller than the average customer size of $10,000 in 2022. In 2023, the average lost customer ARR was $7,000 ($70,000 lost ARR/10 lost customers.
The existing customer base expanded (10% expansion) more than it contracted (3% contraction), providing 7% YoY net growth from Company X’s existing install base.
Simple bridges like those above can provide very valuable insight into how well a company is performing overall, how effective the sales and marketing team is in bringing in new customers, how well a company is retaining customers, and how existing customers are utilizing the solution.
READ MORE: Understanding and Optimizing Unit Economics in SaaS (A Guide for Founders)
SaaS Company Y: Bridge Analysis Example
As important as growth is, however, it can sometimes mask serious underlying issues. A bridge analysis can also show when a company is not performing well and highlight key areas for improvement. An example using a different company shows how.
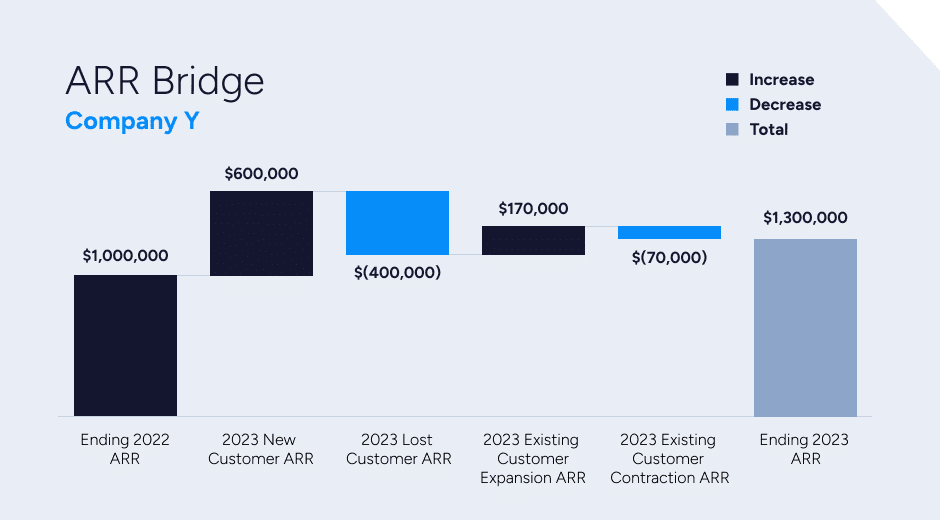
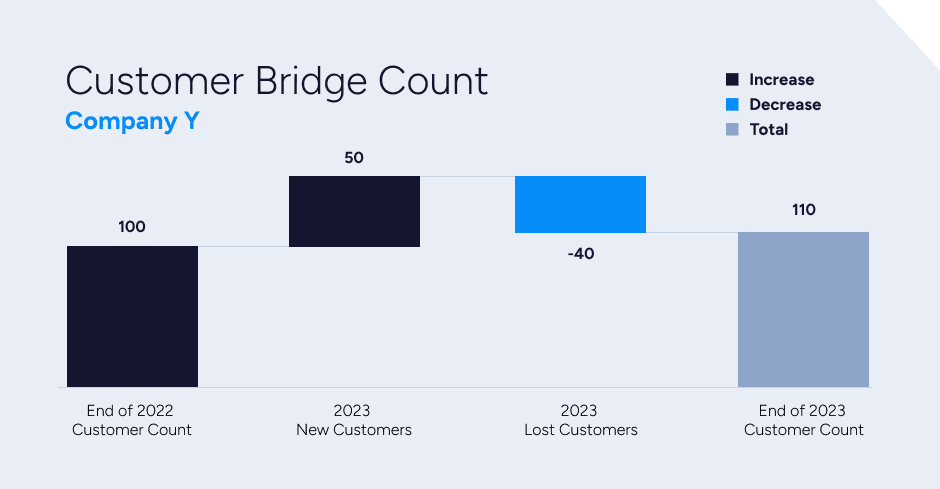
Let’s assume Company Y brought on 50 new customers worth $600,000 in ARR, and lost 40 customers worth $400,000 in ARR. A portion of existing customers collectively expanded by $170,000, while other existing customers collectively contracted by $70,000.
Just like Company X, Company Y ended the year with 100 customers worth $1,300,000 in ARR, but a look at the charts shows us that Company Y is not performing as well as Company X.
Understanding the Bridge Charts for Company Y
Although Company Y’s new customers grew ARR by 60%, lost customers accounted for a 40% loss of ARR. This nets out to FEWER net new customer ARR than Company X. Lost ARR retention was 60%, gross ARR retention was 53%, net ARR retention was 70%, and customer logo retention was 60%.
Though both Company X and Company Y ended with 110 customers and $1,300,000 in ARR, Company X performed much better and more smoothly than Company Y. Though Company Y brought on an enormous number of new customers, they lost close to the same amount. Since it’s much cheaper to retain existing customers than acquire new customers, Company Y will likely spend much more money over time trying to recoup those customer numbers.
These bridge charts can help Company Y understand where it can improve and could potentially have a tremendous impact on its future operations.
What Story Do Your Company’s Financials Tell?
If you’re curious about how to position your company for the best M&A outcome, we offer a complimentary strategic assessment to uncover its potential. Customer count and annual recurring revenue bridges are just examples of the in-depth analyses required to put your company’s best foot forward when presenting to potential buyers.
As part of our process, we’ll show you how the right guidance and storytelling can help you highlight your company’s unique strengths and potential, helping to maximize your valuation and ensure a successful transaction. Please contact us to schedule your complimentary assessment today.