An overview of our sell-side M&A services


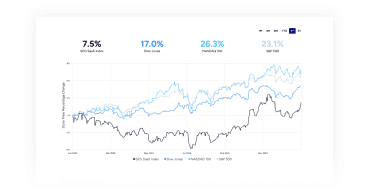
SEG’s 2026 Annual SaaS Report combines analysis of more than 100 publicly traded companies in the SEG SaaS Index™ with a review of nearly 2,700 SaaS M&A transactions completed in 2025. Across both public and private markets, the results reinforce what buyers reward most today: durable growth and retention, plus products that are deeply embedded in workflows and data. Companies that can mitigate AI risk while leveraging it within their platform are increasingly positioned for stronger outcomes.