An overview of our sell-side M&A services


The Data Infrastructure You Need for Reliable Go Get Analysis

You understand what a Go Get is: the new ARR required to achieve your forecast that you don’t have yet. You know how to weight pipeline, calculate coverage ratios, and run the analysis.
But Go Get analysis is not just valuable as a one-time exercise. Its real power comes when it becomes a monthly operating rhythm that helps you see around corners, identify problems early, and make better resource allocation decisions.
What separates the CEOs who truly transform their software, SaaS and AI businesses from those who run the analysis once and move on? Data infrastructure.
Most founders we work with do not have this in place when they start. They have a CRM and a handful of metrics. But they do not have the systematic data capture, clean definitions, historical tracking, or review cadence required to make Go Get analysis reliable and repeatable.
This is not about buying expensive software or hiring a data team. It is about being deliberate about what data you track, how you define it, and how you maintain it. Let’s walk through what you need.
The CRM Fields You Must Track
Your CRM is the foundation of Go Get analysis, but most CRMs out of the box do not capture what you need. Start with the basics that most companies already track: opportunity name, account name, opportunity owner, and opportunity amount (ARR value, not total contract value). And then move to these other critical fields:
Close Date
This field is only useful if you set realistic dates based on your sales cycle, not optimism. Close dates should be anchored to the next buyer action and updated only when that action is completed. They should also be informed by historical data, which we’ll talk more about later.
Stage
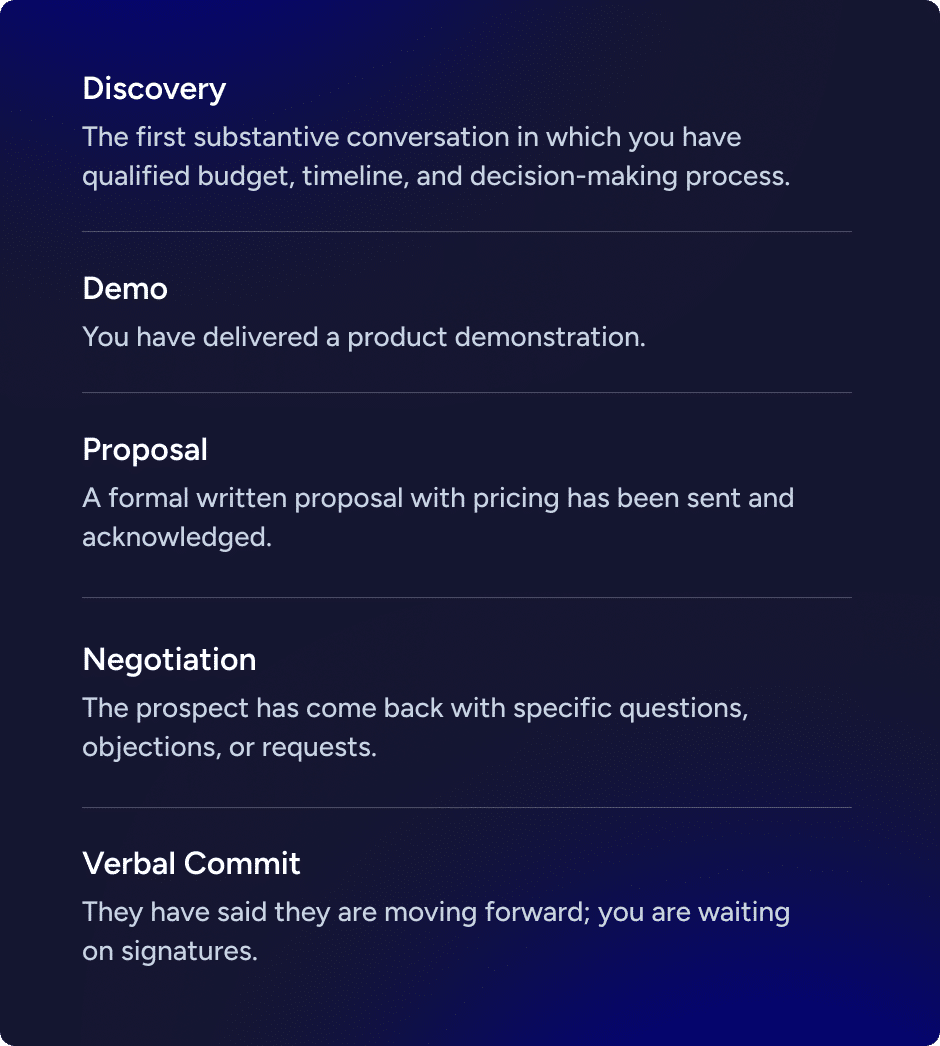
Stage requires clear, objective definitions that your sales team applies consistently. If two reps would place the same deal in different stages, your definitions are not tight enough. For example:
Opportunity Source
Was this an inbound lead, outbound prospecting, partner referral, or existing customer expansion? Different sources have different conversion rates and sales cycles. Your inbound demo requests might convert at 35% while your cold outbound converts at 12%. Without source tracking, you cannot accurately segment your pipeline.
Customer Type
Is this a new customer or an expansion with an existing customer? Expansion deals typically have higher win rates, shorter sales cycles, and more predictable outcomes. If you are weighting them the same as new customer opportunities, your forecast might be wrong.
Deal Size Category
Segment by ACV (Annual Contract Value). For example, you could bucket deals as SMB (under $15,000), mid-market ($15,000 to $75,000), and enterprise (over $75,000). Each segment will have different sales cycles and win rates.
Days in Current Stage
Many companies do not track this but absolutely should. This helps identify deals that are stalling. If your average time in Proposal stage is 18 days, for example, and a deal has been sitting for 60, that is not a hot deal. That deal should have its probability adjusted downward or be moved to closed-lost.
Last Activity Date
This helps you identify zombie deals. If there has been no meaningful activity in 45 days, the deal is likely dead even if your AE has not marked it closed-lost.
Tracking Historical Conversion Rates: The Foundation of Accurate Weighting
Raw CRM data is useful, but the real power comes from analyzing that data over time to understand your actual conversion patterns. This is how you move from guessing at sales stage probabilities to knowing them. This replaces assumed probabilities with evidence-based ones, making pipeline weighting and Go Get analysis far more reliable.
Calculate the following:
Stage-to-stage conversion rates: Of all the opportunities that reached Discovery stage in the past 12 months, what percentage progressed to Demo? Of those that reached Demo, what percentage progressed to Proposal? Knowing these rates will help you understand where deals fall out of your funnel.
Stage-to-close conversion rates: Of all opportunities that reached Discovery in the past 12 months, what percentage ultimately closed? That is your stage probability. If 22 out of 100 opportunities that reached Discovery closed, your Discovery probability is 22%, not 15% or 30%.
Conversion rates are not uniform. Segment them by customer type, deal size, source, and product line. Your conversion rate for expansion deals will be different from new customer deals. Your enterprise conversion rate will be different from SMB. Treating these as a blended funnel obscures risk and distorts weighting.
- What is your average time from opportunity creation to close?
- What is the average for deals that ultimately closed vs. deals that closed-lost?
- How long do deals typically spend in each stage?
Close date accuracy: For all the deals you forecasted to close, what percentage closed last quarter versus slipped to the next quarter or closed-lost? If only 40% of the deals you forecasted to close last quarter closed, you have a close-date discipline problem that undermines your Go Get analysis.
Pipeline creation by month: How much new weighted pipeline are you generating each month? This is critical for understanding your effective coverage ratio, especially with shorter sales cycles where deals created this month can still close in your target period.
Common Mistakes That Undermine Data Quality
Even with the right fields and the right processes, data quality can deteriorate quickly if you are not vigilant about common mistakes. Let’s address those we see most frequently.
Mistake No. 1: Treating your CRM as a task management system rather than a forecasting tool
AEs mark deals as Proposal because they need to remember to send a proposal, not because they have sent one and received acknowledgment. This inflates your late-stage pipeline and makes your coverage ratio look better than it is.
Mistake No. 2: Allowing optimistic close dates with no accountability
An AE puts a close date of “end of this month” on every deal because that is when they want it to close, not when it is likely to close based on the documented sales cycle. When deals do not close, they just push the close date out another quarter. This makes Close Date meaningless as a field.
Mistake No. 3: Never closing lost opportunities
AEs leave deals open indefinitely because closing them as lost hurts their metrics or their ego. Your pipeline fills up with zombie deals that make coverage appear healthy when it isn’t. You need a firm policy: if there has been no meaningful buyer activity in 45 days, the deal is closed-lost unless the AE can articulate a specific reason why it is still live.
Mistake No. 4: Inconsistent stage definitions across the team
One AE’s Negotiation is another AE’s Proposal. This makes your stage-based probabilities meaningless because you are aggregating deals that are not actually comparable. You need written stage definitions, and you need to audit deals regularly to ensure everyone is consistently applying them.
Mistake No. 5: Not updating deals as circumstances change
The champion left the company three weeks ago, but the deal is still marked as “Negotiation” at 75% probability. Budget got frozen, but the deal is still in your pipeline with the original close date. Your CRM should reflect current reality, not the reality from when the deal was last updated.
Simple Go Get Data Templates to Get Started
You do not need to build a complex data warehouse to do Go Get analysis well. Here are three simple templates that will get you 80% of the way there.
Go Get bridge template: This is a spreadsheet with your starting ARR, your CARR components (price increases, pending launches, contractual expansions, renewal expansions), churn buffer, the resulting Go Get, and then your weighted pipeline broken down by segment. Update this monthly and track it over time to see trends.
Pipeline health dashboard: This pulls from your CRM and shows you key metrics: total pipeline, weighted pipeline, coverage ratio, pipeline by stage, average deal age, deals with no activity in 30-plus days, and deals where close date has slipped. Review this weekly with your sales leader.
Deal review template for top opportunities: For each of your largest deals (anything over a set threshold, say $50,000), have a one-page summary: account name, deal size, stage, probability, close date, days in current stage, last activity, next action, key risks or blockers. Review these in detail in your monthly Go Get meeting.
The value is not in the tool; it is in the discipline of updating them consistently and using them to make decisions.
Training Your Team on Data Hygiene
Infrastructure and templates are worthless if your team does not maintain data quality. This requires training and accountability.
Document your stage definitions and conversion rate expectations. Every AE should know exactly what qualifies a deal to move from Discovery to Demo, from Demo to Proposal, from Proposal to Negotiation. They should also know what your historical conversion rates are so they understand that not every deal should be weighted at 90%.
Implement weekly pipeline reviews where managers spot-check deals and ask questions. For any deal in late stages, the manager should ask:

Create accountability for close-date accuracy. Track what percentage of each AE’s forecasted deals actually close in the forecasted period. If an AE is consistently forecasting deals to close that do not, they either do not understand the sales cycle, or they are being deliberately optimistic. Either way, it is a coaching opportunity.
Make pipeline hygiene part of your compensation or bonus structure. If an AE’s pipeline is filled with stale deals that have not had activity in 60 days, that should impact their performance review. If they are consistently accurate in their forecasting, reward that.
Lead by example. If you as CEO are rigorous about your own Go Get analysis, present it to your board with precision, and use it to make resource allocation decisions, your team will follow. If you treat it as a checkbox exercise that does not actually inform decisions, they will treat their CRM the same way.
Connecting Go Get Analysis to Other Key Metrics
Go Get analysis does not exist in isolation. It informs many of your other key software metrics. Understanding these connections helps you build a more holistic view of your business health. Here are some examples:
Go Get and ARR Growth Rate: Your Go Get serves as the foundation for your projected ARR growth. Where you aspire to be needs to be supported by a go-get analysis, and real-time tracking will help you make adjustments to your growth forecast in real time to avoid being surprised at the end of the period.
Go Get and Pipeline Coverage: Pipeline coverage ratio measures how much pipeline you have relative to your go-get. A low ratio suggests you may be over-forecasting, while a high ratio may indicate a more conservative outlook. It’s useful to look at both unweighted and weighted coverage. Unweighted reflects total pipeline volume, while weighted accounts for deal probability. In a perfect world with accurate weighting, weighted coverage should be around 1x, though many teams target closer to 1.5x to allow some buffer.
- Go Get and Sales Efficiency Metrics: Sales efficiency metrics like CAC (Customer Acquisition Cost) and payback period help measure how effectively you’re turning sales and marketing spend into revenue. Having an accurate and up to date view of these metrics gives leaders a clearer view of where they’re getting the most return and how to allocate resources more effectively in order to achieve their go get.
Go Get and Sales Cycle Length: Sales cycle length impacts cash flow and working capital needs. If your sales cycle is extending (which you will see in your conversion rate tracking), you need more working capital to sustain operations while waiting for deals to close. This should inform your cash management strategy.
Go Get and Win Rates by Segment: Win rates by segment inform your ideal customer profile and go-to-market strategy. If your enterprise win rate is 45% but your SMB win rate is 15%, you should probably be allocating more resources to enterprise sales, even if the deals take longer to close.
Go Get and Retention Assumptions: Churn assumptions embedded in your Go Get should tie directly to your gross and net retention metrics. If you are projecting 5% annual churn in your Go Get but your actual gross retention has been 85% (15% churn), address the disconnect.
The Monthly Go Get Review: Making This a Living Discipline
When the infrastructure and governance are in place, implement a monthly cadence to pressure-test your forecast and the data that feeds it. Here is what a monthly Go Get review should look like.
Start by recalculating your CARR.
Begin with what is truly “in the bag.” Account for scheduled price increases, customers currently in implementation who are expected to go live, contractual expansions already committed, and renewal expansions you can reasonably count on. Then layer in upcoming renewals and apply a realistic retention rate based on current customer health. The result is your updated CARR, the revenue you should expect to retain and expand without closing a single new deal.
Update your target.
If you run a rolling six-month Go Get, your target moves forward each month. In January, you are looking at June 30. In February, you are forecasting to July 31. The target is not static; it rolls forward with time.
Recalculate your actual Go Get.
Target minus starting ARR, plus CARR, minus expected churn. This is the new ARR you must generate to hit your six-month target.
Refresh your weighted pipeline for opportunities expected to close in that six-month window.
Apply your current stage-based probabilities (updated based on last quarter’s actual conversion data). Segment by customer type and deal size. Adjust for sales cycle by filtering deals that are too new to close within your target period.
Calculate your coverage ratio.
Coverage ratio tells you whether your pipeline is realistically capable of delivering the revenue you still need to close. The formula is:
Graphic:
Coverage Ratio = Weighted Pipeline ÷ Go Get (Revenue Target)
How does this compare to last month? Are you trending better or worse? If you are trending worse, why? Is pipeline creation slowing down? Are deals slipping out of your target period? Are deals moving backward in stage or being marked closed-lost?
Review your top 10 to 15 deals by weighted value.
For each, ask: Has the stage changed since last month? Is the close date still realistic? When was the last meaningful interaction with the prospect? What is the next action, and when is it scheduled? Are there any blockers we need to address?
Identify deals that are at risk.
Any deal that has been in the same stage for longer than your average time in that stage is at risk. Any deal where there has not been activity in 30 days is at risk. Any deal where the close date has slipped twice is at risk. These deals need attention, or they need to be closed-lost to clean up your pipeline.
Make decisions.
If your coverage ratio is insufficient, what is your plan? Accelerate pipeline generation? Reallocate resources to higher-probability deals? Adjust your forecast? Your review is most valuable when it leads to action.
What’s Next: Connecting This to Valuation
You now have the framework (Part 1), the analytical tools (Part 2), and the infrastructure (Part 3) to run Go Get analysis as a monthly discipline. You understand what to track, how to calculate it, and how to maintain data quality over time.
But why does this matter beyond just hitting your quarterly targets? Because when you eventually go through a transaction process, whether that is in six months or six years, buyers will scrutinize every element of your Go Get with extraordinary detail.
In Part 4, we will show you exactly what that diligence looks like. We will walk through the questions buyers ask, the data they demand, and how your ability to produce a credible, defensible Go Get analysis directly impacts your valuation.
We will explain why companies that can demonstrate predictable growth through rigorous Go Get analysis command premium multiples, and why companies that cannot often leave millions on the table.
Most importantly, we will connect the operating discipline we have built in Parts 1 through 3 to the ultimate outcome: building a company that buyers fight over because you have proven you know exactly how your growth engine works.
Need help building your Go Get infrastructure? At SEG, we advise B2B software companies to develop the operational discipline and infrastructure that drives predictable growth and premium valuations. Whether you are preparing for a transaction or simply want to run your business with greater precision, we can help. Contact us to learn more.