An overview of our sell-side M&A services


How to Weight Your SaaS Pipeline for Accurate Forecasting

Your VP of Sales walks into your pipeline review meeting and says:
“Great news. We have $8 million in the pipeline for Q4. Our Go Get is only $2 million. We are in great shape.”
You’re relieved. The math works; you have four times the coverage. Plenty of room for error.
Then December arrives. You close $1.2 million instead of $2 million, missing your target by 40%. Your board is frustrated.
Upon closer examination, you realize that the $8 million pipeline number was an illusion. Half were stale deals that should have been closed-lost months ago. Another chunk had close dates that ignored your actual sales cycle. What appeared to be 4X coverage was, in practice, far less.
This is the gap between knowing your Go Get number and knowing whether you can hit it.
In Part 1, we introduced the Go Get framework and showed how to calculate the gap between where your ARR is today and where it needs to be. We also introduced CARR (Contracted Annual Recurring Revenue) and why separating what’s already “in the bag” from what still has to be won changes how you plan.
But knowing you need $2.1 million in new ARR is only the starting point. The harder question is whether your pipeline can realistically deliver it. That answer doesn’t come from total pipeline dollars.
It comes from understanding your weighted pipeline, your coverage ratios, and the relationship between your sales cycle and pipeline visibility. In other words, how your sales process behaves in the real world.
Why Total Sales Pipeline Is a Vanity Metric
The most common mistake SaaS founders make when assessing their Go Get is starting with total pipeline.
“Total pipeline” usually means every open opportunity in the CRM that hasn’t been marked closed-won or closed-lost. It doesn’t matter when the deal entered the pipeline, what stage it’s in, or how likely it is to close. If it’s open, it’s counted.
That number feels reassuring because it’s big. But big doesn’t mean useful. Total pipeline blends deals that are fundamentally different:
- The enterprise deal that has been stuck in legal review for six months
- The inbound lead from last week who just scheduled a discovery call
- The expansion opportunity with a customer who mentioned they “might” add users next quarter
They all count the same. And that’s the problem. Total pipeline is a measure of possibility, not probability. Possibilities don’t pay the bills. Probabilities do.
Sophisticated operators focus on the weighted pipeline instead. Weighted pipeline adjusts each opportunity based on how likely it is to close, using historical conversion data tied to your sales stages. For example:
Early-stage deals may be weighted at 10%, while late-stage deals count for much more. The goal is realism. When you’re managing to a Go Get, early truth is more valuable.
How Probability Changes Across Sales Stages
Not all sales stages are created equal. Every stage in your sales process has a different historical probability of converting to a closed-won deal.
Let’s look at a typical B2B SaaS sales process:
An opportunity in the Discovery Stage (first meaningful conversation, understanding needs) has a 10% to 15% probability of eventually closing, based on historical conversion rates. There may be interest, but budget, urgency, and authority are still unproven.
Once an opportunity moves to Demo or Presentation Stage (product demonstration, solution alignment), the probability of close may increase to 30%. Not 70% because a meeting “went well”: 30% because that’s what actually happens. The prospect has invested time to see your solution. But they are likely looking at your competitors, too.
In the Proposal or Quote Stage (formal proposal submitted, pricing shared), the probability might jump to 50%. You have moved from education to negotiation. The prospect is seriously considering a purchase in the near term.
When you reach Negotiation or Contract Review (legal and procurement involved, discussing terms), you are looking at up to 80% probability. The customer wants to move forward, and you are working through the details. You can have greater confidence in the revenue.
Finally, in Verbal Commit or Closed-Won Pending Signature, the opportunity may have reached 90% to 95%. The decision has been made. You are just waiting on paperwork and final approvals.
When teams assign probabilities based on how the deal feels “right now” rather than how similar deals have behaved over time, the pipeline looks strong, but consistently under-delivers. Stage-based weighting replaces hope with evidence. These percentages should be based on your actual historical data. If 28 of the last 100 opportunities that reached the Demo stage ultimately closed, your Demo Stage probability should be 28%.
The Coverage Ratio: Your Early Pipeline Warning System
Once your pipeline is weighted correctly, calculate your coverage ratio. Coverage ratio tells you whether your pipeline is realistically capable of delivering the revenue you still need to close.
The formula is simple:
Coverage Ratio = Weighted Pipeline ÷ Go Get (Revenue Target)
If your Go Get is $2 million in new ARR and your weighted pipeline is $4 million, your coverage ratio is 2X.
That number represents capacity. Based on how your sales funnel has historically performed, a 2X coverage ratio suggests you have twice the probable revenue you need to hit the target.
What is a Good Coverage Ratio?
There is no universal benchmark. We often hear people cite 3X to 5X pipeline coverage, but those numbers are usually based on unweighted pipeline coverage and, without context, don’t tell you much.
A business selling to SMBs with a 45-day sales cycle and a 40% win rate needs very different coverage than an enterprise business with a 12-month sales cycle and a 15% win rate.
An SMB business may be comfortable with 1.5X to 2X coverage because deals move quickly, and they can generate a new pipeline quickly. The enterprise business might need 4X to 5X coverage because deals move slowly and win rates are lower.
That’s what makes the weighted coverage ratio approach an equalizer: It removes arbitrary benchmarks and replaces them with your own history. A weighted coverage ratio of 1X means, based on past performance, your business has what it needs to hit the number. Anything below that is a warning, and anything above it is a buffer.
Why Coverage Ratio is an Early Warning System
Coverage ratio matters because it tells you the truth. Imagine it’s Oct. 1. You need to close $600,000 by Dec. 31, but your total unweighted pipeline is only $450,000. You have a 0.75X unweighted coverage ratio.
Even if every deal in your pipeline closes (which never happens), you’re still $150,000 short. That is not a problem you want to discover in late December. That is a problem you want to see in early October when you still have time to respond.
What the Sales Cycle Reveals About Timing Risk
Even a perfectly weighted pipeline can mislead. That’s because probability alone doesn’t determine whether you can hit your Go Get. Timing does, and that is governed by your sales cycle.
Your sales cycle is the average time from the first meaningful conversation to a closed deal. And it determines which deals in your pipeline are available to help you hit a near-term target.
Let’s say your historical sales cycle is six months. You’re building your Go Get for the next quarter. You look at your pipeline and see $5 million in opportunities. On the surface, that looks sufficient. But when you filter for deals that have been in your pipeline long enough to realistically close within the next three months, only $1.5 million remains.
The other $3.5 million? That’s not a bad pipeline. It’s just a future pipeline. Those deals may close eventually, but history says they won’t close in the window that matters for the next quarter.
This is why understanding your sales cycle by stage is so critical. You need to know not just your overall cycle time, but how long deals typically spend in each stage. If deals usually spend:
- 30 days in Discovery
- 20 days in Demo
- 15 days in Proposal
- 25 days in Negotiation
Then you can look at a deal that entered Discovery last week and know it will most likely not close this quarter.
And remember: Sales cycle also varies by deal size, customer segment, and product complexity. Your $10,000 SMB deals might close in 30 days, while your $200,000 enterprise deals may take nine months. When building your Go Get, segment your pipeline and apply the appropriate sales cycle assumptions to each segment.
Common Sales Pipeline Hygiene Problems That Undermine Go Get Accuracy
Even with proper weighting and sales-cycle analysis, your Go Get is only as reliable as the data that feeds it. Most missed forecasts aren’t caused by bad strategy. They’re caused by minor hygiene issues that compound over time and inflate confidence.
We consistently see four that matter most:
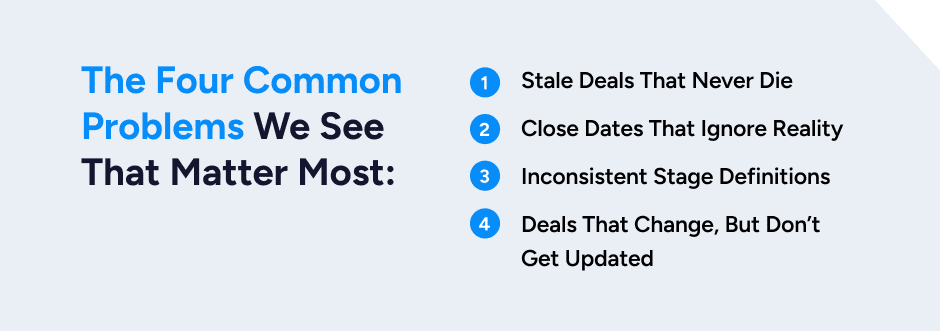
Stale Deals That Never Die
Opportunities that should have been closed-lost months ago continue sitting in your pipeline because sales reps either resist taking the loss or have simply forgotten to update the record. Either way, the result is the same: deals that are no longer real inflate pipeline totals. Stale deals are especially dangerous in later stages, where they carry higher probability weights.
Close Dates That Ignore Reality
A deal entered the pipeline two weeks ago. The rep assigned a close date at the end of the month, even though your average sales cycle is four months. On paper, it looks like near-term coverage. In reality, it’s a future deal being counted too early.
Inconsistent Stage Definitions
One rep moves deals to Proposal after sending pricing; another only does so after multiple budget conversations. They’re applying the same weight to different situations. Without clear objective criteria for each stage, your data can’t support accurate forecasting.
Deals That Change, But Don’t Get Updated
A deal that was hot three months ago may have cooled significantly. The champion left the company. The budget got frozen. A competitor entered the picture. But your AE has not updated the stage or probability because they are busy working on new deals.
These issues compound quickly. If 20% of your pipeline consists of stale deals and another 15% has unrealistic close dates, your weighted pipeline may be overstated. Your coverage ratio looks fine, until it isn’t.
How to Build a Realistic Weighted Sales Pipeline for Your Go Get
A weighted pipeline only works if it reflects how your business sells. A realistic weighted pipeline rests on five conditions:

1. Establish clear stage definitions.
Every stage in your pipeline must have a clear, objective definition. For example, “Proposal” means a formal proposal has been sent and acknowledged. “Negotiation” means the buyer has returned with specific objections or terms to resolve, not that they are merely thinking about it.
2. Calculate historical conversion rates by stage.
Pull 12 to 24 months of closed deals and calculate how many opportunities converted after reaching each stage. Those rates become your probabilities. If only 18% of Discovery stage opportunities from the past two years closed, your Discovery probability is 18%, regardless of how confident your AEs feel about current deals. If this data doesn’t exist yet, start tracking it now.
3. Implement close date discipline.
Close dates should reflect your historical sales cycle. If a deal enters the pipeline today, its earliest realistic close date should align with how long similar deals have taken in the past. Faster movement should be an exception and justified by evidence.
4. Regularly scrub the pipeline.
A weighted pipeline is not set-it-and-forget-it. Run weekly or biweekly reviews focused on accuracy.
- Has the stage changed?
- Has new information emerged that changes the probability?
- Does the close date still make sense?
- Has buyer engagement increased or stalled?
5. Track accuracy over time.
Each quarter, compare your weighted pipeline from 90 days ago to what closed. If your weighted pipeline suggested you would close $800,000, but you only closed $500,000, your weighting is too aggressive. You are overestimating probabilities, failing to account for the sales cycle, or tolerating poor pipeline hygiene. Adjust your assumptions based on what actually happens, not what you wish would happen.
What a Healthy Pipeline Distribution Looks Like
Once your pipeline is weighted correctly, time-adjusted, and clean, there’s one more question to ask:
Where is your risk concentrated?
The total pipeline and coverage ratio tells you how much potential you have. Pipeline distribution tells you where that potential lives. A healthy pipeline is balanced across early, middle, and late stages. You need deals in Discovery to feed Demo. Deals in Demo feed Proposal. Deals in Proposal feed Negotiation. And so on.
Two patterns should trigger concern:
1. Too much weight in the early stages.
If most of your weighted pipeline sits in Discovery or Demo stages, you’re betting that a large number of early-stage deals will progress successfully through multiple stages in a short period of time. That rarely happens. Early-stage concentration usually means your actual close rate will be lower than your weighted numbers suggest. The pipeline looks healthy today, but the risk is being pushed forward rather than resolved.
2. Too much weight in the late stages.
Conversely, if most of your weighted pipeline is in Negotiation and Verbal Commit, you may hit the current period’s target, but you’re starving the future. Once those deals close or slip, there’s no momentum.
So, what does “healthy” look like? A balanced pipeline generally has:
- 30% to 40% of the weighted value in the early stages
- 30% to 40% in middle stages
- 20% to 30% in late stages
This isn’t a hard and fast rule, but a better balance ensures:
- Enough late-stage deals to close near-term revenue
- Enough mid-stage deals to sustain the next period
- Enough early-stage deals to keep the system replenished
Pipeline distribution tells you whether a steady flow of conversion supports your Go Get, or whether it depends on a narrow set of outcomes going perfectly.
The Relationship Between Pipeline Generation and Go Get
Up to this point, we’ve focused on the pipeline you already have. But your ability to hit your Go Get rarely depends on that pipeline alone. It also depends on how quickly you can create new pipeline that will close within your target period.
If your sales cycle is shorter than your Go Get period, new opportunities created today can still contribute meaningfully to the outcome. If your sales cycle is long, they can’t.
For example:
- You need $2 million in new ARR over the next six months.
- Your weighted pipeline today is $3 million, giving you 1.5X coverage.
That sounds acceptable until you realize that over the next six months, you will also be generating new pipeline.
If you typically generate $1 million in new weighted pipeline per month, and your sales cycle is three months, deals created in months 1 through 3 could still close in months 4 through 6.
In other words, that $3 million in the pipeline is not your only shot at the $2 million Go Get. You will create another $3 million in weighted pipeline over the next three months (at $1 million per month), bringing your total to $6 million. Your effective coverage ratio is not 1.5X; it is 3X when you account for pipeline generation.
Your historical pipeline creation rate is as crucial as your conversion rates and sales cycle. This is why companies with shorter sales cycles can operate with lower day-one coverage ratios. They can course-correct by ramping up the pipeline if they are trending behind.
Bringing It All Together: A Complete Go Get Example
Your Go Get rate is supported by a system:
- The pipeline you have today
- How it’s weighted and distributed
- How fast new pipeline is created
- Whether that pipeline has time to convert
Let’s walk through an example that ties these four concepts together.
Imagine you are a B2B SaaS company at $7.5 million ARR on July 1.
- Year-end target: $10 million
- CARR (price increases, pending launches, contractual expansions, renewal expansions): $430,000
- Expecting: $25,000 in churn
- Go Get: $2.1 million
- Total pipeline expected to close by Dec. 31: $6.8 million
All of this sounds great, until you apply your stage-based probability weights derived from historical data. After weighting:
- Pipeline value: $3.1 million.
- Coverage ratio: 1.5X ($3.1 million divided by $2.10 million).
This example assumes a pipeline consisting entirely of new customer opportunities. But many companies also see expansion opportunities with existing customers. The stage definitions and historical conversion rates will likely differ from those for new customers. It is essential to weight both types of pipeline opportunities separately to ensure maximum accuracy.
Now you factor in the sales cycle.
Your average sales cycle is four months. It is July 1, and you need to close deals by Dec. 31. That is six months. You look at when each opportunity entered your pipeline. $800,000 of your weighted pipeline value comes from deals that were entered in the past 30 days. Based on your four-month sales cycle, most of those deals will not close until November or later. Some may slip to January.
Your effective weighted pipeline for deals with high confidence to close by year-end is now $1.8 million. Your coverage ratio is 0.86X. You need $2.1 million, and you have $1.8 million. You are short by $300,000.
This is the value of rigorous Go Get analysis. On the surface, with $6.8 million in total pipeline, you looked fine. After proper weighting, segmentation, and sales-cycle adjustment, you are $300,000 short with six months to close the gap.
That is a problem you can solve in July. It is not a problem you can solve in December.
What’s Next: Building the Infrastructure for Go Get
Running the Go Get analysis properly once won’t change outcomes. The advantage will come from making it a repeatable operating discipline, supported by the right infrastructure and habits.
In Part 3, we will focus on what makes this sustainable. We’ll cover what you need to track in your CRM to support accurate weighting, how to structure pipeline reviews, the templates that make this analysis manageable, and how to train your team to maintain data quality. We’ll also share which leading indicators signal risk early.
In Part 4, we will connect this directly to valuation. We’ll show you what buyers scrutinize during diligence, how they pressure-test your Go Get, and why companies that can explain their growth math with clarity and consistency command higher multiples.
The goal is not just to hit this quarter’s numbers. It’s to build a predictable and scalable growth engine that you can understand, defend, and explain with confidence.
Need help building your Go Get framework? We work with B2B software companies with $5 million to $100 million in ARR to build operational discipline and forecasting clarity that support predictable growth and premium valuations. Whether you are preparing for a transaction or simply want more confidence in your business’s performance, we can help.