An overview of our sell-side M&A services


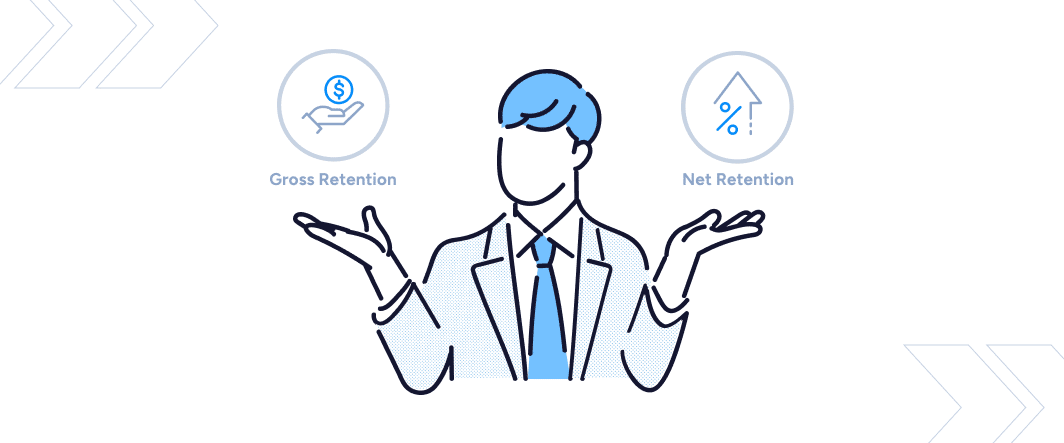
Gross Retention vs. Net Retention: The Pivotal Shift in SaaS M&A
The software M&A market is like a living and breathing organism: constantly evolving, adapting, and reacting to the world around it. This is especially true in recent years, with COVID driving historic SaaS adoption and the monetary and fiscal policy that followed, creating a unique M&A dynamic. At SEG, our job is to track how the markets evolve and help SaaS founders and operators understand these moving parts and what it means for their businesses. Sometimes, that means doing our favorite thing: debating ourselves. This time, we’ll discuss gross retention vs. net retention.
Previously, we delved into the significance of Net ARR Retention and the compounding effect it has on SaaS company performance and valuations. While all of what was shared in that piece remains true, in recent years, we have seen buyers and investors crown a new king of retention: Gross Retention.
Understanding Gross Retention vs. Net Retention
The evolution of the M&A markets has led strategic buyers and PE investors on the buy-side to increasingly emphasize gross retention as a key metric. This shift is notable, considering that net retention used to be the primary retention metric. Do not just take our word for it: In a recent SEG survey to buyers and investors, the majority of respondents said that gross retention is an incredibly important metric, even higher than net retention.
Why is this? For starters, gross retention serves as a measure of how effectively a company maintains its existing revenue by minimizing churn rates. It simply calculates the lost Annual Recurring Revenue (ARR) and contraction ARR, divided by the ARR the company had at the beginning of the year.
While both gross retention and net retention are important metrics for analyzing and valuing software and SaaS businesses, gross retention offers a more accurate reflection of long-term durability. The increased significance placed on gross retention by buyers and investors stems from its ability to provide more direct insight into a product’s stickiness and mission-critical nature, two important attributes that these groups seek in M&A targets.
Net retention figures can be inflated by a strong sales/upsell function. Put differently, net retention can cover a lot of sins. While this makes it a reliable metric in favorable markets, what happens when the sales environment is less fertile? This is where gross retention offers better insight into a company’s ability to withstand challenging economic circumstances. A company with robust gross retention experiences fewer “leaks in the bucket,” allowing any future success to contribute to growth rather than compensating for losses.

Illustrative Example of Gross Retention vs. Net Retention
At SEG, we are data junkies, so let us walk through an example that illustrates mechanically why there has been a shift in preference.
Take two companies, Company A and Company B, who both were enjoying nice growth throughout the mass software adoption event that was the late 2010s/early 2020s. Both companies have a net retention of 120%, but the underlying metrics reveal different strategies and dynamics.
Company A focuses on driving growth via expansion by utilizing an aggressive upsell and land and expand strategy, and less so on account management and customer success. This strategy yields a gross churn of -20%, upsell of 40%, and new customer growth of 15%.
Company A
Gross Churn %
-20%
Upsell %
40%
New %
15%
Year 1
Year 2
Year 3
Year 4
Year 5
Beginning ARR
$ 10,000,000
$13,500,000
$ 18,225,000
$24,603,750
$ 33,215,063
New
$ 1,500,000
$ 2,025,000
$2,733,750
$3,690,563
$ 4,982,259
Expansion
$ 4,000,000
$ 5,400,000
$ 7,290,000
$9,841,500
$13,286,025
Churn/Contraction
$ (2,000,000)
$ (2,700,000)
$ (3,645,000)
$ (4,920,750)
$ (6,643,013)
Ending ARR
$ 13,500,000
$ 18,225,000
$ 24,603,750
$ 33,215,063
$ 44,840,334
35%
35%
35%
35%
35%
On the other hand, Company B prioritizes customer health and account management as opposed to farming expansion ARR, which results in gross churn of -5%, upsell of 25%, and new customer growth of 15%.
Company B
Gross Churn %
-5%
Upsell %
25%
New %
15%
Year 1
Year 2
Year 3
Year 4
Year 5
Beginning ARR
$ 10,000,000
$13,500,000
$ 18,225,000
$24,603,750
$ 33,215,063
New
$ 1,500,000
$ 2,025,000
$2,733,750
$3,690,563
$ 4,982,259
Expansion
$ 2,500,000
$ 3,375,000
$4,556,250
$ 6,150,938
$ 8,303,766
Churn/Contraction
$ (500,000)
$ (675,000)
$ (911,250)
$ (1,230,188)
$ (1,660,753)
Ending ARR
$ 13,500,000
$18,225,000
$ 24,603,750
$ 33,215,063
$ 44,840,334
35%
35%
35%
35%
35%
As you can see, both companies are thriving with 35% annual ARR growth, leading to more than tripling ARR over five years.
The New Normal
However, this model hinges on one key assumption: that the macroeconomic, and thus SaaS sales environment, remained constant. We know that is not a sound assumption when looking at gross retention vs. net retention. The current market presents more sales challenges between layoffs, high-interest rates, and the potential for a recession resulting in tighter budgets.
In the new market reality, let us assume both companies see their upsell % cut in half for the first two years, and the new ARR decreases from 15% annual growth to 10%. After two years, both companies return to their pre-down-market performance. If Company A’s gross churn stays constant at -20%, net retention drops to 100% and then jumps back up to 120% after two years. Starting with $10M ARR in Year 1, Company A reaches $29.7M after Year 5.
Company A
Year 1-2
Year 3-5
Gross Churn %
-20%
Upsell %
20%
New %
10%
Gross Churn %
-20%
Upsell %
40%
New %
15%
Year 1
Year 2
Year 3
Year 4
Year 5
Beginning ARR
$ 10,000,000
$ 11,000,000
$ 12,100,000
$ 16,335,000
$ 22,052,250
New
$ 1,000,000
$ 1,100,000
$ 1,815,000
$ 2,450,250
$ 3,307,838
Expansion
$ 2,000,000
$ 2,200,000
$ 4,840,000
$ 6,534,000
$ 8,820,900
Churn/Contraction
$ (2,000,000)
$ (2,200,000)
$ (2,420,000)
$ (3,267,000)
$ (4,410,450)
Ending ARR
$11,000,000
$17,100,000
$16,335,000
$22,052,250
$29,770,538
10%
10%
35%
35%
35%
In comparison, Company B manages to retain its customers despite challenging market conditions, given its historic focus on account management and customer success. Company B does not need to exert the same level of effort as Company A to drive sales and expansion, and in a scenario where upsell % is cut in half and net new growth is reduced to 10%, net retention falls to 108% instead of the 100% Company A experienced. With a return to more normalized levels in Year 3 (25% upsell and 15% new growth), Company B achieves $33.9 million ARR after Year 5, starting from the same $10 million ARR.
Company B
Year 1-2
Year 3-5
Gross Churn %
-5%
Upsell %
12.5%
New %
10%
Gross Churn %
-5%
Upsell %
25%
New %
15%
Year 1
Year 2
Year 3
Year 4
Year 5
Beginning ARR
$10,000,000
$11,750,000
$13,806,250
$18,638,438
$25,161,891
New
$1,000,000
$1,175,000
$2,070,938
$2,795,766
$3,774,284
Expansion
$1,250,000
$1,468,750
$ 3,451,563
$4,659,609
$ 6,290,473
Churn/Contraction
$ (500,000)
$ (587,500)
$ (690,313)
$ (931,922)
$ (1,258,095)
Ending ARR
$11,750,000
$13,806,250
$18,638,438
$25,161,891
$33,968,552
18%
18%
35%
35%
35%
Company B clearly emerges as the better company, given the higher ending ARR driven by its ability to hold on to its customers.
Areas for Improvements and Their Effects
Let us give the operators of these two businesses some credit, though: they are savvy, so they use a challenging market as an opportunity to improve on some weaknesses.
For Company A, this means investing in fixing the leaky boat. Imagine they not only return to normalized efforts in Year 3 but also improve churn by 5%, reducing it to -15%. With this adjustment, Company A reaches approximately $33.2 million in Year 5. Despite this improvement, it still does not match Company B’s performance.
Company A
Year 1-2
Year 3-5
Gross Churn %
-20%
Upsell %
20%
New %
10%
Gross Churn %
-15%
Upsell %
40%
New %
15%
Year 1
Year 2
Year 3
Year 4
Year 5
Beginning ARR
$10,000,000
$11,000,000
$12,100,000
$16,940,000
$23,716,000
New
$ 1,000,000
$ 1,100,000
$ 1,815,000
$ 2,541,000
$ 3,557,400
Expansion
$ 2,000,000
$2,200,000
$ 4,840,000
$ 6,776,000
$9,486,400
Churn/Contraction
$ (2,000,000)
$ (2,200,000)
$ (1,815,000)
$ (2,541,000)
$(3,557,400)
Ending ARR
$11,000,000
$12,100,000
$16,940,000
$23,716,000
$33,202,400
10%
10%
40%
40%
40%
Let’s assume the investment not only succeeds in reducing churn 5%, but is even more effective and cuts churn in half, bringing it down to -10%. In this case, Company A reaches the following:
Company A
Year 1-2
Year 3-5
Gross Churn %
-20%
Upsell %
20%
New %
10%
Gross Churn %
-10%
Upsell %
40%
New %
15%
Year 1
Year 2
Year 3
Year 4
Year 5
Beginning ARR
$10,000,000
$11,000,000
$12,100,000
$17,545,000
$25,440,250
New
$ 1,000,000
$1,100,000
$ 1,815,000
$2,631,750
$ 3,816,038
Expansion
$ 2,000,000
$2,200,000
$ 4,840,000
$ 7,018,000
$10,176,100
Churn/Contraction
$ (2,000,000)
$ (2,200,000)
$ (1,210,000)
$ (1,754,500)
$(2,544,025)
Ending ARR
$11,000,000
$12,100,000
$17,545,000
$25,440,250
$36,888,363
10%
10%
45%
45%
45%
After these large improvements, Company A finally achieves an ending ARR that challenges Company B.
However, Company B also seizes the opportunity to make some improvements. While maintaining stellar retention, they focus on their sales function and go-to-market engine, resulting in a modest 5% increase in upsell and a 5% increase in new growth. This lands them at a net retention of 125% after two years, with 20% new ARR growth, resulting in $42M of ARR after five years, once again outpacing Company A.
Company B
Year 1-2
Year 3-5
Gross Churn %
-5%
Upsell %
12.5%
New %
10%
Gross Churn %
-5%
Upsell %
30%
New %
20%
Year 1
Year 2
Year 3
Year 4
Year 5
Beginning ARR
$10,000,000
$11,750,000
$13,806,250
$20,019,063
$29,027,641
New
$1,000,000
$1,175,000
$2,761,250
$4,003,813
$ 5,805,528
Expansion
$1,250,000
$1,468,750
$4,141,875
$ 6,005,719
$ 8,708,292
Churn/Contraction
$ (500,000)
$ (587,500)
$ (690,313)
$ (1,000,953)
$ (1,451,382)
Ending ARR
$11,750,000
$13,806,250
$20,019,063
$29,027,641
$42,090,079
18%
18%
45%
45%
45%
Even if Company B chooses not to invest heavily in growing sales, its strong retention provides a floor from a growth standpoint that Company A does not have. This creates operational flexibility for Company B and the ability to be intentional with investment because it does not need to patch the “leaky boat” the same way that Company A must.
Gross Retention (vs. Net Retention) is the Stronger Metric for SaaS M&A
If net retention has a compounding effect on ARR, as we previously illustrated, then gross retention acts as the principal amount that supports the interest being paid. We all love interest, but it does not get to compound if the amount it is being generated from decreases. Strong gross retention ensures that is not the case, and for that reason, buyers and investors have prioritized it as the best metric for durability and sustainability amidst a less certain market cycle.
An investor feels a lot better about backing Company B today than it does Company A. Company B has a higher probability of achieving growth and executing on its forecast, presenting less risk. It stands to reason that gross retention has replaced net retention in the hierarchy of buyer and investor needs.
The cherry on top is that higher gross retention leads to higher valuations, so whether the businesses are pursuing an M&A event today or in 5 years, Company B is better off. Today, Company B will receive a higher multiple on the same ARR because of its superior gross retention, and in 5 years, it will receive the same or a higher multiple on more ARR, still with higher gross retention.
SaaS Metrics that Matter for Your Company’s Valuation
Overall, the focus on gross retention (vs. net retention) as a key metric reflects the importance of maintaining long-term stability and minimizing customer churn. SEG has identified the SaaS metrics of highest importance in the eyes of strategic buyers and PE investors. To understand what metrics matter when valuing your company, download your free copy of our 20 Factors White Paper.