SEG Analyst, Paxton Earl, shares an overview of SEG’s 2Q26 Quarterly SaaS Report. Tailored for SaaS founders and executives, our latest research provides the insights necessary for making informed decisions in strategic growth or exit planning.
TRANSCRIPTION
Introduction
{Paxton Earl:} Hello, everyone. I’m Paxton Earl, senior analyst at Software Equity Group. And today, I’m going to walk you through our 2Q 2026 SaaS M&A and Public Market report, and highlight the most interesting and important trends we’re seeing both across M&A and public SaaS markets. We’ll cover where deal activity is heading, how valuations are changing, what both strategic and private equity buyers are prioritizing, and how public SaaS companies are performing operationally and how that affects your SaaS business. Our goal with this report is to give software executives, investors, and other industry people in software the data and context they need to make the most informed strategic decisions. So with that, let’s get into it.
2Q26 SaaS Overview
{Paxton Earl:} Hello, everyone. I’m Paxton Earl, senior analyst at Software Equity Group. And today, I’m going to walk you through our 2Q 2026 SaaS M&A and public markets report, and highlight the most interesting and important trends we’re seeing both across M&A and public SaaS markets. We’ll cover where deal activity is heading, how valuations are changing, what both strategic and private equity buyers are prioritizing, and how public SaaS companies are performing operationally and how that affects your SaaS business. Our goal with this report is to give software executives, investors, and other industry people in software the data and context they need to make the most informed strategic decisions. So with that, let’s get into it.
Starting with the 2Q SaaS overview, the first half of 2026 was crazy for SaaS. In the first quarter, we saw public SaaS valuations under a lot of pressure in the first quarter as investors tried to understand and reprice what AI could mean for the long-term value and defensibility of software companies. At the same time, the broader macroeconomic environment remained uncertain as well. We saw geopolitical risks, commodity prices volatility, and shifting expectations around inflation and GDP growth. And even within that environment, the SaaS market still proved to be resilient through the second quarter. In the first quarter of the year, public SaaS stocks took a massive hit, but they recovered a lot in the second quarter, nearly 10 percentage points from their lows in April. They were down, at the time, around 30%, and they finished June just down 22%. So still down to the year, but a massive improvement from what we saw in the first quarter.
From an M&A perspective, deal activity also held up well as volume increased both quarter over quarter compared to 1Q26 and year over year compared to 2Q25 and trailing 12 months. On the trailing 12-month data, SaaS M&A volume was up 16%. However, buyers, both strategic and private equity, even though deal volume is up, are becoming much more selective. Acquisition and deal activity is becoming increasingly concentrated around companies with clear strategic fit, meaningful AI relevance, proprietary or valuable data and workflows, and products that are deeply embedded within customer workflows. We’re also potentially starting to see some of the selectivity and the pressure reflected in M&A valuations, as the median trailing 12-month revenue multiple declined slightly from 4.2x to 4.0x, and the average declined from 6.3x to 6.2x. And while it’s not a massive decline, it’s the consecutive period of decline in M&A multiples. And that could be, as a factor, downward valuation pressures that we saw in the public markets.
So, all that to say is most SaaS transactions are still clearing in a compressed tight valuation range, but at the same time, the best and most scarce valuable SaaS assets are still achieving very high outcomes, as high as 10x to 15x revenue in a very competitive high-value M&A process.
SaaS M&A Updates
{Paxton Earl:} So with that, let’s start looking at SaaS M&A deal volume. In the second quarter of 2026, there were 698 SaaS M&A transactions. That was up nearly 10% from the 637 transactions in 2Q of ’25. And on a trailing 12-month basis, deal volume reached 2,784 deals, which is up 16% from the prior trailing 12-month period in the previous year, which makes it the most active trailing 12-month window we’ve tracked. And we believe SaaS volume is remaining elevated over the long term for a few reasons. First, there’s more SaaS businesses today as the broader software market is evolving and becoming more broad every single year. The universe of potential SaaS targets continues to expand. Secondly, buyers are using M&A to add digital capabilities, enter new markets and expand their products more quickly than they could through internal development alone. So, M&A is becoming an even higher priority for a lot of companies. And third, AI is becoming a huge factor in the types of companies that are being acquired. We’ll go into it in a later slide, but a significant growing number of companies every single quarter are becoming AI-referenced SaaS businesses.
Whether they’re truly AI native or not, they are referencing AI in some fashion in their business description or strategic rationale for the deal, and almost 78% of the time. So the overall M&A market remains active, but buyers are putting a much greater emphasis on strategic fit, AI relevance, differentiator proprietary data, and workflow embedment, and long-term defensibility that can give them comfort in this AI environment.
Moving on to that, let’s go into a quick deep dive on the multiples. So, both the median and average SaaS M&A multiples declined from the first quarter of 2026 and are on a consecutive decline also from 4Q25. And what we’re seeing is that might be a typical lag we see from public and private markets. What we’ve seen is that private M&A markets typically lag public markets by roughly six to 12 months. And now that we’re through the SaaS apocalypse having now been around seven, eight months mark, buyers in the M&A market might be starting to have some downward pressure on M&A multiples that we saw in the public markets. Of the SaaS M&A multiples that were disclosed, not every deal that we have data on even has a disclosed multiple because they keep them private most of the time, but 75% of disclosed multiples were below 5X and 60 were below 4X. And so, while it’s important to note that the majority don’t disclose transactions, it’s still a valuable dataset that even when there are disclosed multiples, they’re still transacting in a tight range.
However, there are still another dataset where there’s the best assets that are clearing at the highest multiples. For example, Salesforce acquired Finn at nine and a half times revenue, Thoma Bravo acquired Kneat at 9.1X, and Rubrik acquired Strata at 7.5X. So the average SaaS deal is clearing at a lower valuation, but the best-in-class assets are still receiving the highest multiples.
Now, we’ll move on to buyer composition. This is one of the most interesting trends that we’re seeing in SaaS M&A right now, and it’s that direct private equity platform deals have dropped significantly. Looking at the chart and the data, private equity direct deals have historically represented between nine to 10% of deal activity, looking at the second and third quarter in ’25. However, that share has fallen to roughly 6%. At the same time, we’re seeing a much greater uptick in concentration in private equity and venture-invested strategic acquires. This group accounted for nearly 35% of SaaS M&A activity, while PE-backed strategics accounted for nearly 18% in comparison to the PE direct deals, which are just 6%. Even though the PE deals at just 6%, PE direct deals are just at 6%, private equity is still very involved in all of these. If you sum up the private equity-invested, private equity-backed strategic, and private equity direct deals, it’s still 59% of transactions.
But the reason being is strategics, and PE-backed strategics, and private equity and venture strategics, they’re acquiring AI-enabled businesses that can strengthen their products, improve their data advantages and critical workflows, and reinforce their competitive positioning. And this is very evident in the buyer data. Salesforce, they’ve acquired 12 SaaS businesses in the last 12 months. Databricks and OpenAI have each acquired six. Anthropic, Accenture, Apple, and Snowflake, have each acquired five. And then Cloudflare, CrowdStrike, and NVIDIA were also highly active with four deals. So, these are just some headline number of large strategics that have acquired massive numbers of SaaS business in the trillion in 12 months, showing that this data trend that we’re seeing in the chart is really showing up, and that we’re seeing some of the large strategics are acquiring SaaS businesses at a very high clip. And the reason being is that these companies, these SaaS business that can immediately strengthen an existing platform’s AI capabilities, data advantages, strategic companies want them right now to try to make them as competitive and evolve as fast as possible in this AI environment.
AI-Referenced SaaS M&A
{Paxton Earl:} To continue talking about AI deals, one of the things we started doing at [inaudible 00:08:40] was we just started tagging SaaS M&A transactions that referenced AI-related terms in the business description or strategic rationale for the deal. It includes words such as artificial intelligence, machine learning, LLM, computer vision, and similar language. And just even using that simple approach, in the second quarter, there were 542 AI-referenced SaaS deals, and that represented nearly 78% of all SaaS M&A in this quarter. For comparison, AI-referenced transactions represented approximately 66% of deals a year ago and 54% in 2024. Several of the highest profile deals this quarter also fell into this group, including SpaceX acquisition of Cursor for more than 57 billion, Qualcomm’s acquisition of Modular, and Salesforce acquisition of Finn. And while this analysis is largely just a word count screen and doesn’t really determine whether the deal’s fully cleared because they’re truly AI native or not, it does show that AI is becoming a much more common requirement in how SaaS companies are describing their products, explaining their strategic relevance, and what buyers are prioritizing.
And so for software executives, the question is no longer whether the company should simply just be using AI. It’s how does AI improve the product, improve your business, give you a stronger data advantage, expand the value that’s being delivered to your customers? And more importantly, from the data we’re seeing for strategic buyers, how does it compliment a strategic buyer to get really excited and want to buy your business right now because you have something that they don’t have?
Public SaaS Market Performance
{Paxton Earl:} Now, we’ll move on to the public market data. Looking at the public market data, public SaaS companies are becoming larger, more profitable, and more operationally efficient than they’ve ever been before. Median trailing 12-month revenue hit an all-time high at nearly 1.2 billion. Median EBITDA is at an all-time high at over 110 million, and year-over-year EBITDA growth was almost at 30%. Revenue growth also ticked up quarter over quarter, which was one of the first sequential movements in revenue growth that we see in several quarters, and profitability is continuing to improve as well. Median EBITDA margins were at 11%, net income margins at 4%, and median cash flow hit a five-quarter high of over 25%. So, these are all great fundamentals. These are all great operating metrics for these businesses. However, despite the fundamentals, the valuations are still compressed. Revenue multiples are down, EBITDA multiples are down, cash multiples are down. Basically, any multiple that has enterprise value at the numerator, or market cap at the numerator, is down.
So, the market is repricing SaaS even lower than their operating metrics as they continue to improve. And another interesting dynamic that’s happening is with respect to cash. So, market capitalizations and valuations have fallen faster as a percentage than cash balances have. So as a result, cash now represents a larger percentage of the market cap value of these SaaS companies, which that can create meaningful liquidity relative to valuations. Because with respect to the percentage of cash as a percentage of their value, they have greater capacity to pursue acquisitions, repurchase shares, or become an acquisition target themselves, becoming potential acquisition targets that are making them more affordable for strategic and private equity buyers. So all in all, there’s a major disconnect between the operating performance, and market pricing. And that fundamentals are improving, but valuations are not. And so that disconnect could be a very important driver for future M&A.
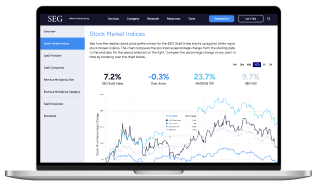
Now, we’ll move on to the public stock price. So looking at the chart, the largest downturn in public SaaS occurred in the first quarter of 2026. You can see the largest drop-off between January and the beginning of April, and that’s really when the SaaSpocalypse was at its heat. But from April onward, the index itself improved, but it was largely flat to improving. So, the bulk of the heat and pressure was in the first quarter, and the second quarter was actually much more optimistic. It was down over 30% on April 10th, but it finished the quarter down 22%. So it was a 10% percentage point improvement. And then on the year-to-date so far, the upper quartile is still up.
So all that to say, as I think we’re seeing some optimism post the SaaSpocalypse, it hit really hard in the first half of this year, but I think in the second half of the second quarter, we’re seeing some uptick and some recovery in valuations. Within the index, cybersecurity was the clearest standout of the index. It gained over 11% year to date and outperformed every single category. Some of the strongest performers include Palo Alto Networks, CrowdStrike, Okta, Tenable, and Varonis. And I think that reason really makes sense. Just as legit companies are using AI to improve efficiency and to make their businesses stronger, the bad guys are also using AI also. So malicious actors, hackers, they’re using AI to find new sophisticated ways to identify vulnerabilities and launch attacks. And so, this makes cybersecurity even more critical for businesses.
And also, their business model completely supports businesses getting stronger. So cybersecurity businesses, they’ll charge a price typically for the amount of points and service area that they might cover for a business and what they’re going to protect. Every single year, businesses are just getting bigger, and they have more vulnerabilities and more areas to protect, so they have to charge more. And it creates a really amazing expansion and net retention story within its own customer base so that they can just continue to expand year over year and become even more embedded into their customer’s business. Even though a lot of the majority of the index was down, there are still some great operating metric companies within the index. So on a revenue growth story perspective, Rubrik grew over 45%. And then Alkami, Shopify, Cloudflare, and Snowflake each grew more than 30%. And on the profitability side, we saw several companies such as MSCI and Verus, they both generated EBIT margins above 55%. So despite the declines in valuations and market capitalizations across the index, many of the underlying companies were still performing very strong operating performances.
And this can provide an optimistic foundation for a broader recovery if these operating metrics and growth continue to strengthen, and investors can become more comfortable with the long-term impact of AI.
Moving on to revenue performance specifically, so public SaaS companies. They’re larger in generating more revenue at scale than at any point in their history. The median revenue mark is at over nearly 1.2 billion, and median growth improved by over 20 basis points quarter over quarter from 12.7% to 12.9%. And that seemed like a relatively small increase, but it was the first sequential improvement in several quarters, and it may indicate that growth is beginning to stabilize and potential accelerate for these public SaaS companies. And the broader growth distribution also improved. Almost 30% of the index-generated growth of at least 20% year over year, and both the 20 to 30% growth cohort and greater than 30% growth cohort expanded from the prior year. At the same time, the percentage of companies that were growing less than 10% declined.
So the overall growth profile’s improving, because there’s fewer companies that are at the lower end of the growth curve, and then there’s more companies that are moving into the higher end. And the strongest growers continue to be concentrated in areas such as data infrastructure, cybersecurity, cloud platforms, commerce, and other very mission-critical workflows. And even with that stronger revenue performance, moving on to revenue multiples, we’ll just see how broad and indiscriminate the valuation reset has been. So looking at this slide, the slide shows that there’s been significant and widespread valuation compression across all the companies. The upper quartile, the average, the median, and the lower quartile revenue multiples are all lower than they were a year before. The median declined from 7.5X to 3.2X, and the upper quartile declined as well. So, the repricing has not been limited to a small group of companies. It’s affected the entire SaaS market.
However, the upper quartile is still trading at a premium. The upper quartile is still growing more than 20%. The EBIT margins are above 20% and they’re producing cash flow at a 30% or higher. So even in a compressed market, investors are still willing to pay more for the businesses with stronger growth, greater profitability, and greater cash generation. So the market has not stopped rewarding quality. It’s just the valuation for, basically, every single company has been repriced to a lower bar than it was a year before. But I think there’s optimism that these will continue to expand once the valuations and the operating performances reach equilibrium again, where right now, performance is really high and valuation’s really low. Eventually, I think they’ll meet each other and we can see multiple expansion.
Weighted Rule of 40 & Closing
{Paxton Earl:} Moving to one of the most interesting slides in this deck, which is the weighted rule of 40. Weighted rule of 40 performance remains one of the clearest valuation differentiators in public SaaS. Looking at the chart, most companies with weighted rule of 40 scores below 40%, they’re trading in a relatively compressed valuation range with not much outliers. Below 10, you’re at 1X, between 10 and 20 are two, between 20 and 30 are three, and between 30 and 40, you’re still three again. But once you cross that 40% threshold, your multiple substantially increases. Now in that chart, you’re trading at over seven times. And so, there’s a very clear valuation step up in every improvement in weighted rule of 40, but once you cross that 40 threshold, you see the biggest change in valuation.
And the composition of weighted rule of 40 still matters. You take two companies, both have a weighted rule of 40 score of 40%, but one’s growing 30% with a 10% margin and the other is growing 10% with a 30% margin, the higher growth company is going to be valued more. And so every incremental percentage point gain in growth versus EBIT margin, assuming you breakeven, the growth will have a greater weighting in terms of what your potential multiple will be. And I think a great example of this is the company Datadog. They generated, roughly, 30% revenue growth and only a 3% EBIT margin, but they were trading at over 19 times revenue. Cloudflare also got a really high multiple because it continued to grow at over 30%. And so probability is important, but once you reach breakeven, it’s all about showing growth, and that’s where you’ll see the greatest gains from a valuation multiple.
That concludes my overview of the SEG 2Q 2026 SaaS M&A and Public Market Report. Thank you for taking the time to listen. You can access the full report through our Software Equity Group’s website, where we also provide additional detail on M&A activity, valuations, buyer behavior, public company performance, SaaS operating benchmarks, an AI chatbot. So if you’re a SaaS founder, you want to ask some questions, understand more about your business and what resources we can provide, that resource is on our website. And if you have questions, you want to talk to a human, you can feel free to follow me, Pax Earl on LinkedIn or Austin Hammer, and be sure to follow Software Equity Group on LinkedIn as well and visit our website. Feel free to reach out with any questions, and we appreciate you taking the time to listen. Thank you.