An overview of our sell-side M&A services


How to Use the SEG SaaS Index™ to Benchmark Your Business
Success in SaaS comes from building a product customers love and from making disciplined decisions about growth, efficiency, and timing. The question most CEOs ask is simple: How do we stack up against the market and our closest peers?
That is exactly why we built the SEG SaaS Index™ and the interactive Index tool. It brings market signals, valuation context, and peer benchmarks into one place so you can calibrate strategy, set realistic targets, and prepare for high-stakes moments like fundraising or an exit.
A quick note: Public and private markets are related but not identical. Use the Index as a barometer of investor sentiment and operating discipline across SaaS, then translate those insights to your specific stage, category, and unit economics.
Discover What the Index Reveals About Market Trends
The SEG SaaS Index™ tracks a curated basket of ~120 public SaaS companies and visualizes trends that matter to operators: stock performance against major indices, revenue multiples over time, benchmarks across categories and size cohorts, and now deeper views into customer health and operating quality. For founders and CEOs, this is less about playing the ticker and more about understanding what today’s market rewards and what it discounts.
Learn How to Navigate the Tool Effectively
Start at the top to understand the market’s risk appetite, then move toward the metrics that connect to enterprise value: growth durability, profitability, efficiency, and retention.
As you move through each view, think in terms of three questions:
- What is the market rewarding right now
- Where do we sit relative to credible peers
- What must change in our plan to close the gap
See How SaaS Stocks Perform Against the Broader Market
The indices view compares the median stock performance of the Index to the NASDAQ 100, S&P 500, and Dow. It is a fast way to understand whether SaaS is running ahead of, in line with, or behind the broader market over different horizons.
When SaaS outperforms the broad market, investors are often more receptive to growth-oriented stories and forward investment. When it lags, the bar for efficiency and predictability gets higher. Use this context to set expectations with your board and to time important moments like a capital raise or a formal process.
Track How SaaS Valuations Shift Over Time
The multiples chart tracks median EV/TTM revenue over time. It shows how fast the market is expanding or compressing the value of a revenue dollar. Looking backward across cycles helps you separate a company-specific story from a market regime shift.
How to apply it: tie your internal valuation expectations to the direction of multiples and the quality of your metrics, not to a number you heard last year. If multiples are compressing, sharpen your story around efficiency and retention. If they are expanding, confirm that your growth is durable, not just promotional.
Benchmark Your Metrics Against Leading Public SaaS Companies
The benchmarks table surfaces current data for more than a hundred public SaaS names and lets you filter by product category and quartile for key indicators like revenue growth, EV/Revenue, EBITDA margin, and year-to-date performance. The power here is focus. Select the category that best reflects how buyers and investors will view you, Security, ERP, Analytics, or a vertical application, and compare against the top and median performers.
What to look for:
- If your growth is above category median but your multiple trails, assume a storytelling or predictability gap. Strengthen forecasting discipline and customer narratives.
- If your multiple is healthy but growth lags, the market is paying you for quality and efficiency. Decide whether to lean into that profile or re-accelerate with targeted investment.
- If you are in the bottom quartile on retention or margin, treat it as a board-level priority and tie remediation to the roadmap and sales motion, not just cost cuts.
Learn Which Categories are Driving the Highest Revenue Multiples
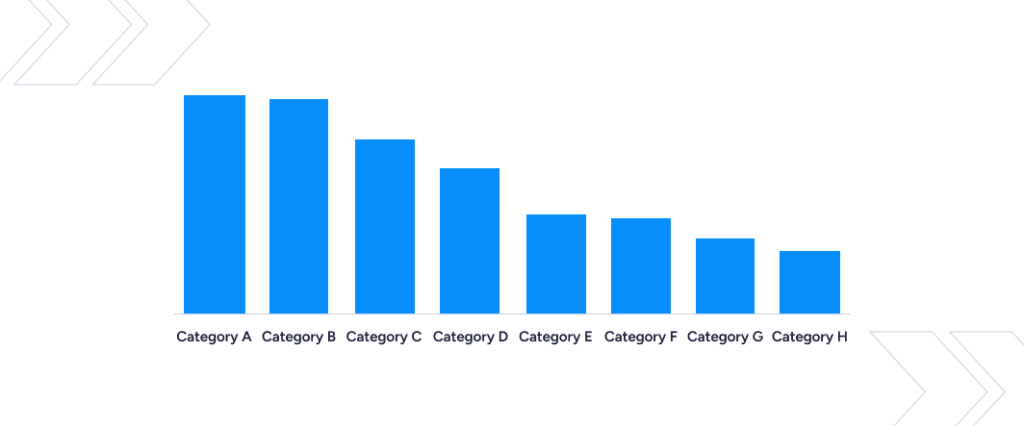
Valuations across SaaS aren’t uniform. Different product categories command very different multiples based on growth, margins, and perceived strategic value. This chart breaks down EV/Revenue multiples by 10 categories, clarifying where the market is rewarding with high premiums and where multiples lag.
For founders and CEOs, this view helps answer critical questions: Are we in a category investors reward most highly? If not, can our positioning highlight attributes that look like those premium segments, such as recurring revenue quality, vertical depth, or expansion potential?
It also helps leadership teams set expectations. Companies in categories trading at lower multiples may need to place more emphasis on operational efficiency, retention, or growth durability to attract similar valuations to higher-premium peers.
See How Growth and Profitability Drive Valuation Premiums
The Rule of 40 balances growth and profitability, but the Weighted version emphasizes profitable growth rather than growth at all costs.
The first chart shows how the SEG SaaS Index companies are distributed across Rule of 40 bands, revealing how many companies hit the 40% threshold.
The second chart connects the dots by showing median valuation multiples at each performance level: companies above 40% consistently trade at higher EV/TTM Revenue multiples than peers below the line.
For founders and CEOs, the message is clear:
- Crossing 40% matters as investors consistently reward it with premium valuations.
- If you are below 40%, you don’t need to fix everything at once. Decide whether margin improvement, sales efficiency, or retention gains will move your score up fastest without stalling durable growth.
Understand How Net Revenue Retention Impacts Valuation
NRR is the clearest indicator of product value and expansion health. The first chart shows how SaaS companies in the SEG SaaS Index distribute across NRR bands, giving you a clear picture of what “typical” retention looks like across the industry.
The second chart connects retention directly to valuation: companies with higher NRR consistently trade at premium EV/TTM Revenue multiples compared to peers with weaker retention.
For leadership teams, this underscores two points: improving retention isn’t just about customer success; it directly influences valuation. If NRR trails the pack, the focus should shift to onboarding, product adoption, or expansion strategies to increase it. And if retention is already strong, it should be front and center in growth narratives and investor discussions since markets consistently reward expansion efficiency.
Turn Market Insights into Strategic Decisions
The Index is most valuable when it becomes a monthly habit and operating ritual. Each quarter, revisit three things with your leadership team:
- Positioning: Are we telling the right category story for the market we are in today
- Plan quality: Do our growth and efficiency targets align with what investors are rewarding
- Readiness: If an offer arrived next quarter, where would diligence pressure-test us first: retention quality, sales efficiency, margin profile, or forecasting
Use those answers to adjust hiring, pricing & packaging, account expansion motion, and, when appropriate, timing for a strategic process.
Get a Tailored Assessment for Your SaaS Company
Public benchmarks do not replace company-specific analysis, but they do provide a clear, shared starting point. The SEG SaaS Index™ tool puts the market’s expectations at your fingertips so you can make faster, better-grounded decisions.
If you want a tailored read on what these signals imply for your valuation and path forward, request a complimentary strategic assessment. We will translate the market’s barometers into a plan for your business, including the peer set buyers will use, the numbers they will scrutinize, and the steps that move your multiple.