An overview of our sell-side M&A services


Public SaaS Company Valuations and What They Mean for Private Companies
Strategic buyers and investors take their cues from public market performance – using it as a benchmark to assess risk, growth potential, and valuations.
When public SaaS valuations are climbing – like they did after the 2024 election –opportunities expand. But when market shifts happen, as we’ve seen in 2025, that can introduce uncertainties to the M&A landscape.
Because public market trends don’t operate in a vacuum, understanding how these dynamics affect deal terms, investment appetite, and exit opportunities is important whether you’re looking to grow, raise capital, or sell. SaaS companies that anticipate shifts and adjust strategies can then position themselves for long-term success.
Software Equity Group’s Annual SaaS Report breaks down these trends. In this article, we explore what public-market shifts mean for private SaaS companies.
What is the SEG SaaS Index™?
Our SEG SaaS Index™ tracks 118 publicly traded companies that primarily offer solutions via the cloud and may have a subscription or transaction-based pricing model. Founded in 2006 as part of SEG’s acclaimed research reports, the Index and the companies within it are updated quarterly.
Valuation Highlights from the Annual SaaS Report
2024 SaaS Stock Prices
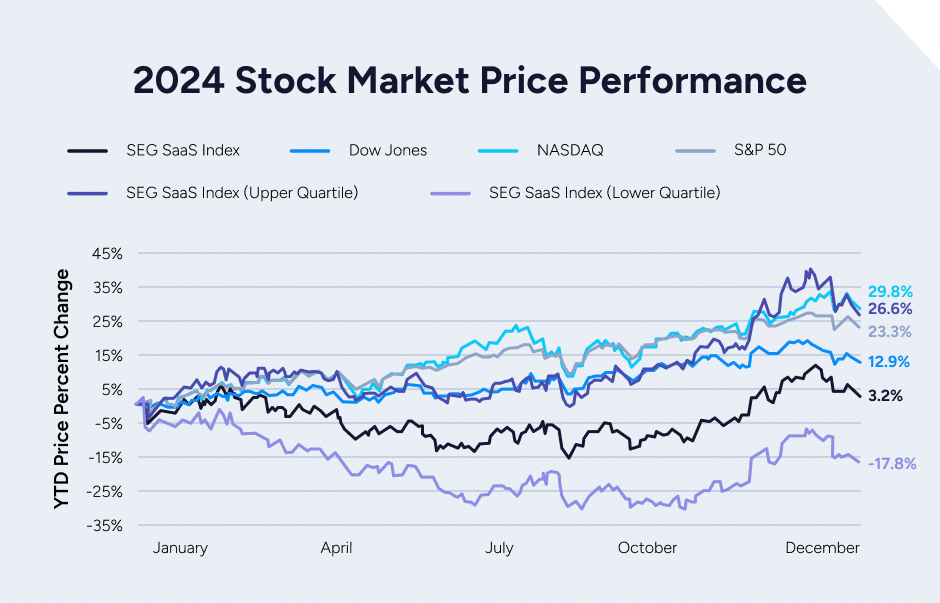
The SEG SaaS Index™ saw a significant turnaround in the third quarter of 2024 and rallied to finish positive on the year from being down as much as 12% year to date in October. The SEG SaaS Index finished up 3.2%, with the upper quartile averaging a 26.6% stock increase.
SaaS EV/Revenue Multiples
The percentage of companies in the Index trading at greater than 10x EV/TTM Revenue increased year over year (21% in 2024 vs. 14% in 2023). That indicates an improving valuation environment for the highest-performing companies.
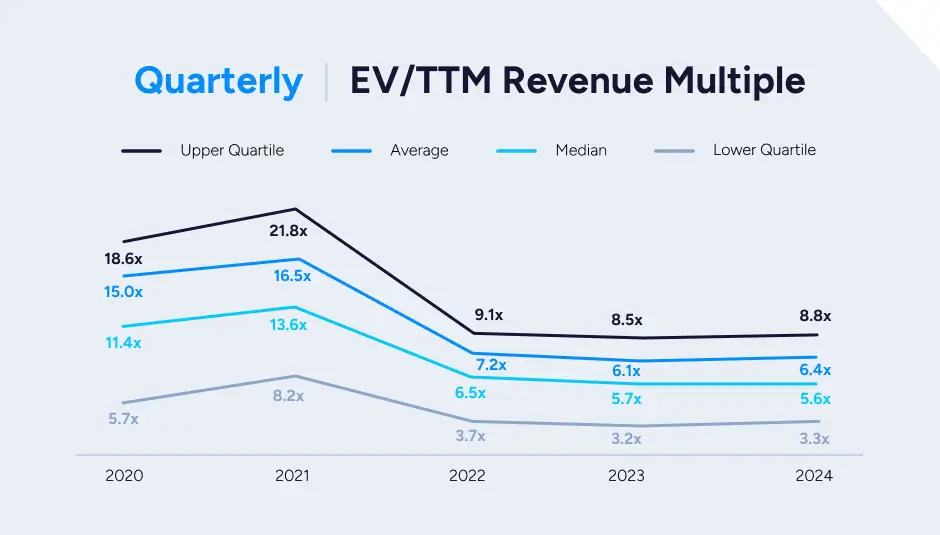
However, the Index underscores the gap between outperformers and laggards. The upper quartile is trading at 8.8x EV/TTM Revenue, a 57% premium to the full Index median; the lower quartile finished 2024 trading at a 41% discount to the median.
The difference can be seen in their underlying fundamentals. The upper quartile reported:
- 21% revenue growth vs. 6% by the lower quartile
- 12% EBITDA margin vs. 1% by lower quartile
Like the public markets, buyers will place higher values on companies that display balanced growth and profitability.
Gross Profit Margin (GPM)
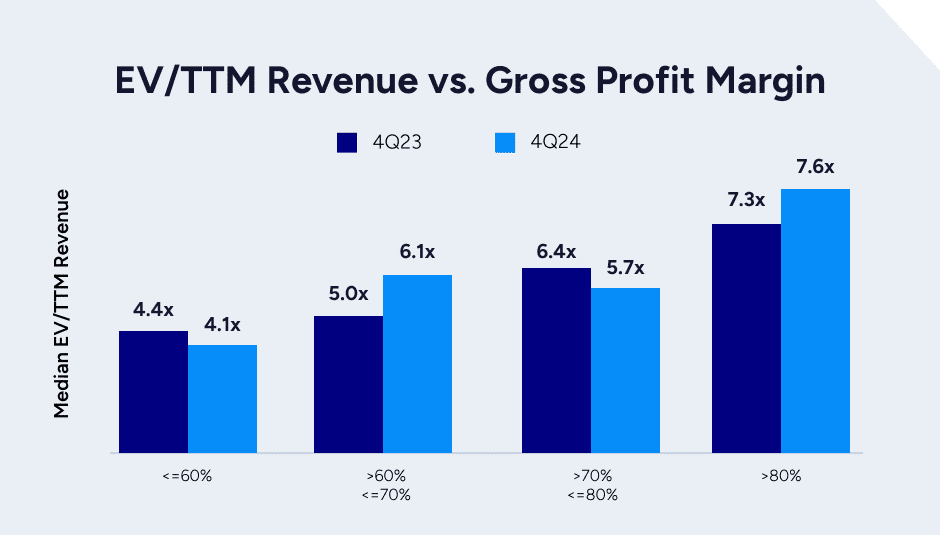
Higher gross profit margins mean companies have more money available to reinvest and, in turn, grow. Not surprisingly, the median gross profit margin was closely tied to above-average valuation multiples in our latest report. In the fourth quarter of 2024, companies with less than 80% gross margins had a median EV/TTM Revenue multiple of 5.5x compared with 7.6x for those with GMs of greater than 80%. That shows the valuation implication of higher gross margins and the associated tipping point that 80% GPM represents.
Average and medium gross profit has been stable over the past year, with the median EV/TTM gross profit multiple decreasing 6% year over year but increasing 5% from the third to fourth quarter.
Weighted Rule of 40
The Weighted Rule of 40 is a crucial KPI that speaks to a company’s ability to effectively balance growth with profitability. The sum of a company’s top-line year-over-year growth rate and its EBITDA margin should ideally be at least 40%.
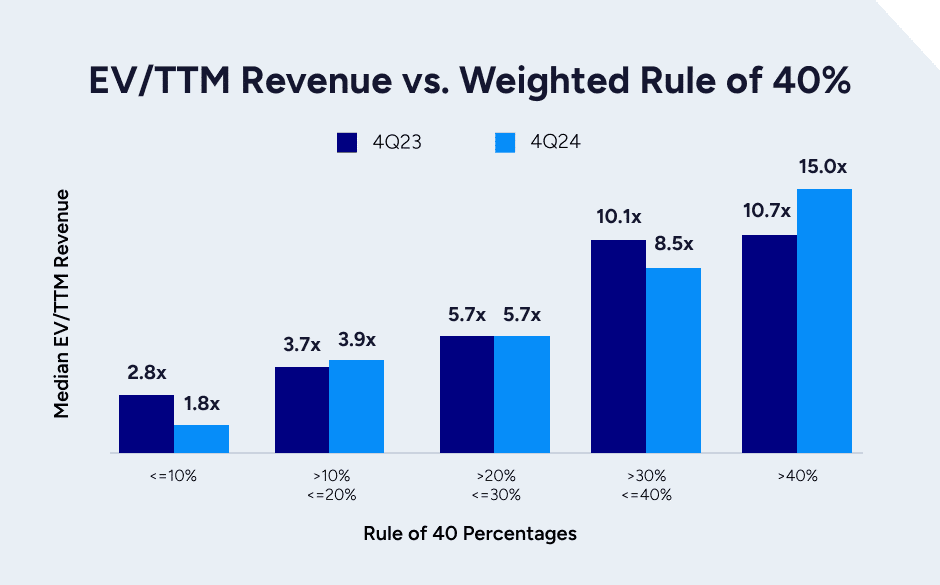
As EV/TTM revenue multiples increase, the Weighted Rule of 40 increases. Businesses with a Weighted Rule of 40 greater than 40% saw multiples increase a staggering 40% year over year. Eight of the 11 top-traded companies in the SEG SaaS Index™ boast 15%+ growth and 10%+ profit. They have proven they can sustain robust, profitable growth, which makes them ideal bets for investors.
Net Retention
Customer retention is a key in both private and public SaaS company valuations. Net retention includes upsell, downsell, and lost ARR and is the most commonly available retention metric shared by public SaaS companies.
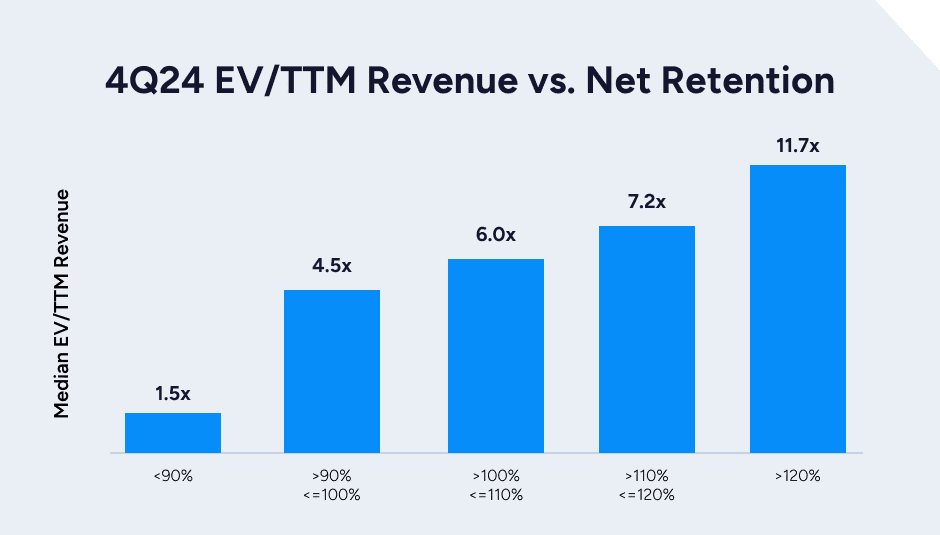
Generally, the greater the net retention, the greater the multiple. In the fourth quarter of 2024, 61% of the companies in the Index that reported retention had net retention of >100%. The 39% of companies with less than 100% net retention saw a median EV/TTM Revenue multiple of 4.1x compared to the total Index median of 5.6x.
On the other hand, the 8% of companies with >120% net retention had a median EV/TTM Revenue multiple of 11.7x, representing a 109% premium to the total Index median of 5.6x and nearly triple the median EV/TTM Revenue multiple of those with a net retention under 100%.
SaaS Revenue Multiple by Product Category
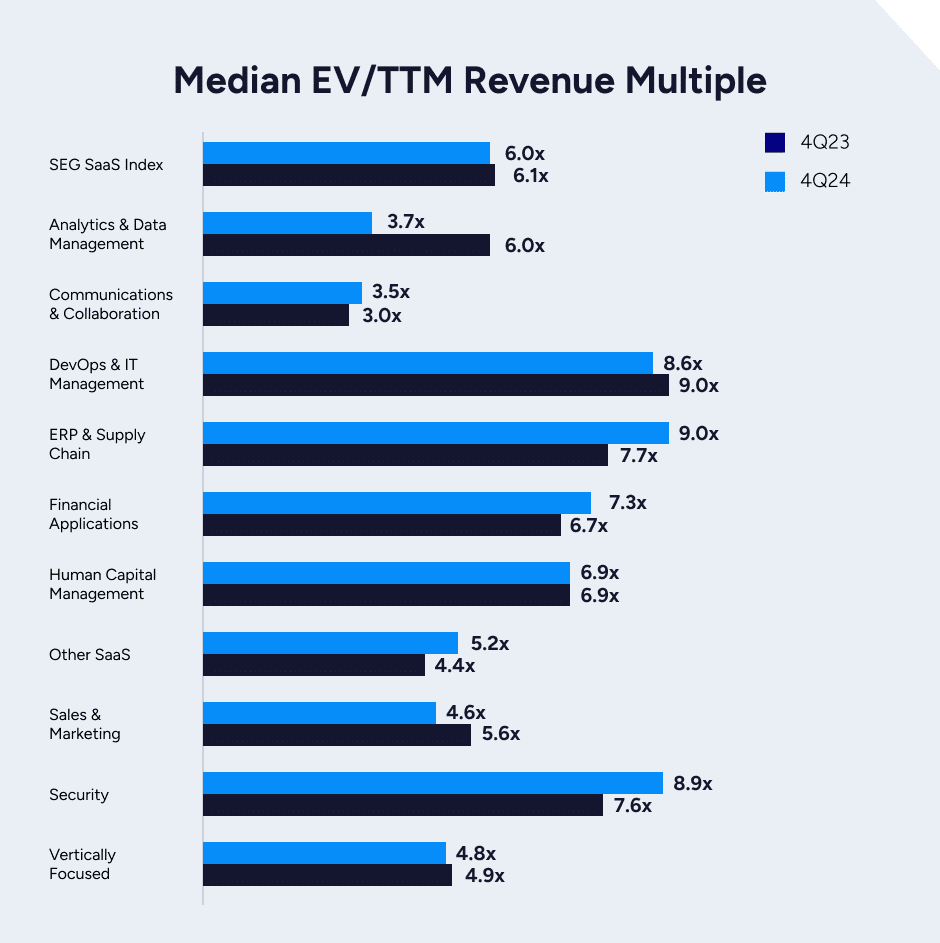
Nine of the Eleven product categories had median EV/TTM revenue multiple increases or remained stable in 2024 compared with 2023. ERP and Supply Chain experienced the biggest increase (9x in 4Q24 vs. 7.7x in 4Q23). Security, Financial Applications, and Communications & Collaboration multiples also increased year over year.
The Vertically Focused group had five companies trading below 3.1x EV/TTM Revenue. Excluding those, Vertically Focused companies yielded a median multiple of 10.2x, nearly double the Index median.
(Go deeper into trends in Vertically Focused markets. Browse our SaaS research reports by category.)
What Is the Takeaway for Private SaaS Companies?
Trends in the SEG Index over the past year hold valuable lessons for private SaaS companies. While the public markets tend to be more volatile, public strategic buyers will always partially value acquisitions from the standpoint of how they themselves are valued.
“When public company valuations are suppressed, there will be downward pressure on private valuations for those companies that public strategics want to acquire,” says Diamond Innabi, Vice President at SEG. The reverse is also true.
Diamond emphasizes that companies with the strongest valuations have a lot in common: high retention, capital efficiency (profitability/free cash flow), and mission-critical categorization. ERP & Supply Chain, for example, continues to outperform other categories, speaking to its value to businesses across the board.
But private company valuations are a function of more than just how the broader markets perform, Diamond says. “We also have seen a lot of activity from private equity investors, who have record amounts of capital to deploy, regardless of public-market performance.”
Hear leading private equity firms’ take on the 2025 software M&A market, including what they value most.

Download our Annual SaaS Report.