Our Services
An overview of our sell-side M&A services

Software deal volume remains strong, totaling 823 deals in 1Q24. Despite a recent decline in SaaS M&A activity over the past two quarters, the 486 SaaS deals in 1Q24 far surpass pre-2022 levels, marking a 50% increase from the Q1 average of 2019-2021. Anticipating three interest rate cuts by the Federal Reserve this year, deal volume is forecasted to rise throughout the remainder of the year.
At SEG, we understand that data is more than just numbers—it’s your strategic advantage. With meticulous analysis of stock and financial data from over 120 publicly-traded SaaS companies and hundreds of software & SaaS M&A transactions, our SEG Research Reports uncover quarter-over-quarter trends and pivotal moments shaping the industry’s trajectory into 2024.
SaaS deal volume is up 50% over the pre-2022 average.
16% of the SEG SaaS Index™ is trading at >12.5x EV/TTM Revenue, up from 5% in 1Q23.
The upper quartile of the SEG SaaS Index™ reached a median EV/TTM multiple of 9.9x. These companies had median revenue growth of 25% and EBITDA margin of 29%.
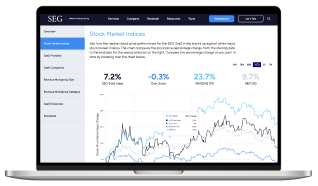
The public market section provides a comprehensive analysis of stock prices, financial data, and valuation performance for over 120 publicly traded B2B software companies constituting our SEG SaaS Index™. Notably, the percentage of Index companies trading at >12.5x EV/TTM revenue multiples surged from 5% in 1Q23 to 16% in 1Q24, signaling a resurgence among top performers. Additionally, the Index’s swift transition toward capital efficiency underscores the SaaS industry’s enduring earning potential.


Multiple categories in the Index exhibited higher median EV/TTM revenue multiples in 1Q24 compared to 1Q23, reflecting the overall strong performance of many Index companies in 2023. Notably, DevOps & IT Management and Security experienced the most significant increases, with revenue multiples rising from 6.6x to 10.1x and from 7.5x to 10.3x, respectively.
SaaS M&A remained robust annually, with 2023 being the second-highest year recorded. However, in the first quarter of 2024, there were 486 deals, showing a 5% increase from the previous quarter (464 deals in 4Q24) but a 14% decrease YOY (567 deals in 1Q23). The decline in the last two quarters is likely due to factors such as regional bank instability in early 2023, macroeconomic concerns, and a high-interest rate environment. Nonetheless, the 486 deals in 1Q24 still significantly surpass pre-2022 levels, marking a 50% increase from the average in Q1 from 2019 to 2021.
In 1Q24, vertically focused businesses accounted for nearly half of all transactions, consistent with 1Q23 figures. Healthcare and Financial Services were the most active verticals, comprising 16% and 15% of SaaS deals, respectively. Notably, Hospitality, Retail, and Manufacturing witnessed increased activity year-over-year, indicating a broadening focus among investors.
Buyers and investors have continued their trend of prioritizing durable and sustainable M&A targets in response to current market conditions. Private equity investors remain dominant, representing 59% of SaaS M&A deals in 1Q24. Strategic buyers, comprising 40.7% of deals, saw their most active two-quarter period since 1Q22. While private equity remains influential in 2024, the resurgence of public equities suggests strategics will maintain increased activity throughout the year.
If you are looking for a past version of SEG’s Annual or Quarterly Reports, you can now download all previously published reports from our archived section.
Gain strategic insights into the SaaS industry with our latest report. Click the button to download your copy.