What’s Your Valuation Potential?

The Interactive SEG SaaS Scorecard is a proprietary scoring tool designed for software companies to provide insights into company valuation potential.

Based on your company’s key financial metrics and operational readiness, you will garner insights regarding metric benchmarks, potential outcomes reflecting buyer preferences, and more. Our tool helps to identify strengths and pinpoint areas needing improvement, guiding you in making strategic decisions to enhance your company’s value.

All inputted data is kept confidential and will not be shared or stored.

05 1
Step 1 of 2

The Quantitative Factors

The following metrics shed light on your company’s health and market potential.

Form data is confidential and never shared or stored.

Step 1 of 2

The Qualitative Factors

The following facets offer a more comprehensive view of your company’s potential.

All inputted data is kept confidential and will not be shared or stored.

(Beginning ARR – Lost ARR – Contraction ARR) / Beginning ARR
(Current Year’s ARR – Previous Year’s ARR) / Previous Year’s ARR. Note: One-time payments are not included.
(Net Income + Interest + Taxes + Depreciation + Amortization) / Total Revenue
The yearly revenue from software subscriptions, often called the annualized version of monthly recurring revenue (MRR).
(Revenue – COGS) / Revenue
(Current Year Total Revenue – Prior Year Total Revenue) / Prior Year Total Revenue. Unlike ARR growth, Revenue Growth aggregates all revenue sources.
Sum of ARR of Top 10 Customers / Total ARR
(Total Customers at beginning of period – Lost Customers in that period) / Total Customers at beginning of period.
(Beginning ARR + Expansion ARR – Lost ARR – Contraction ARR) / Beginning ARR. Also called Net Dollar Retention.
Current and last year info
Select Year
  • Last Year
  • This Year
How software applications are delivered to customers.
Select
  • On-Premise
  • Hybrid
  • Pure Cloud
How customers are charged for products and/or services.
Select
  • Non-Recurring
  • Transactional
  • Contracted Recurring
The application, service, or solution provided and how the offering is perceived and valued in comparison to competitors.
Select
  • Commoditized
  • Differentiated
  • Highly Differentiated
The potential opportunities within a market segment. Factors include size, growth rate, and competitive landscape.
Select
  • Pure Horizontal
  • Multi Vertical
  • Vertically-Focused
The set of frameworks, libraries, software languages, and infrastructure of the software.
Select
  • Legacy
  • Leading Edge
  • State-of-the-Art
The group of executives leading company operations, strategies, and decision-making processes.
Select
  • Less Experienced
  • Strong, Deep
  • Proven History
The % change in the total of all companies in the market, including size, demand, and opportunities.
Select
  • <0%
  • 1-5%
  • >5%
The overall revenue opportunity available to a product or service, assuming 100% market share.
Select
  • <$100 Million
  • $100M - $1 Billion
  • $1 Billion+
THE RESULTS

What’s Your Valuation Potential?

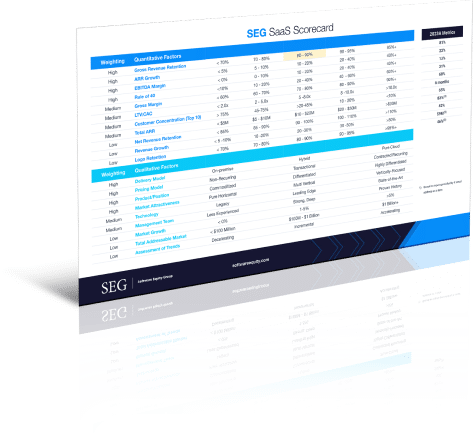
The Interactive SEG SaaS Scorecard™ is a proprietary scoring tool designed for software companies to provide insights into company valuation potential.

Based on your company’s key financial metrics and operational readiness, you will garner insights regarding metric benchmarks, potential outcomes reflecting buyer preferences, and more. Our tool helps to identify strengths and pinpoint areas needing improvement, guiding you in making strategic decisions to enhance your company’s value.

All inputted data is kept confidential and will not be shared or stored.

Not finding your results in the green?

Discover SEG’s unique methodology to evaluate software companies and assess their readiness for exit.

Not finding your results in the green?
Your SaaS Scorecard
Weighting
Quantitative Factors
Lower ARR X
Higher ARR X
High
Gross Revenue Retention
< 70%
70 - 80%
80 - 90%
90 - 95%
95%+
High
ARR Growth
< 5%
5 - 10%
10 - 20%
20 - 40%
40%+
High
EBITDA Margin
< 0%
0 - 10%
10 - 20%
20 - 40%
40%+
High
Rule of 40
< 10%
10 - 20%
20 - 40%
40 - 60%
60%+
Medium
Gross Margin
< 60%
60 - 70%
70 - 80%
80 - 90%
90%+
Medium
Customer Concentration (Top 10)
> 75%
45 - 75%
>20 - 45%
10 - 20%
<10%
Medium
Total ARR
< $5m
$5 - $10M
$10 - $20M
$20 - $30M
>$30M
Low
Net Revenue Retention
< 85%
85 - 90%
90 - 100%
100 - 110%
>110%
Low
Revenue Growth
< 5-10%
10 - 20%
20 - 30%
30 -50%
>50%
Low
Logo Retention
< 70%
70 - 80%
80 - 90%
90 - 95%
>95%+
Weighting
Qualitative Factors
High
Delivery Model
On-Premise
Hybrid
Pure Cloud
High
Pricing Model
Non-Recurring
Transactional
Contracted Recurring
High
Production/Position
Commoditized
Differentiated
Highly Differentiated
High
Market Attractiveness
Pure Horizontal
Multi Vertical
Vertically-Focused
Medium
Technology
Legacy
Leading Edge
State-of-the-Art
Medium
Management Team
Less Experienced
Strong, Deep
Proven History
Low
Market Growth
<0%
1-5%
>5%
Low
Total Addressable Market
<$100 Million
$100M - $1 Billion
$1 Billion+
Low
Assessment of Trends
Decelerating
Incremental
Accelerating
2024A Metrics
0%
0%
0%
0%
0%
0%
$0M
0%
0%
0%

1) Based on inputs provided on .

Before You Go

Please take a screenshot or write down your results, as we do not store or share this data.